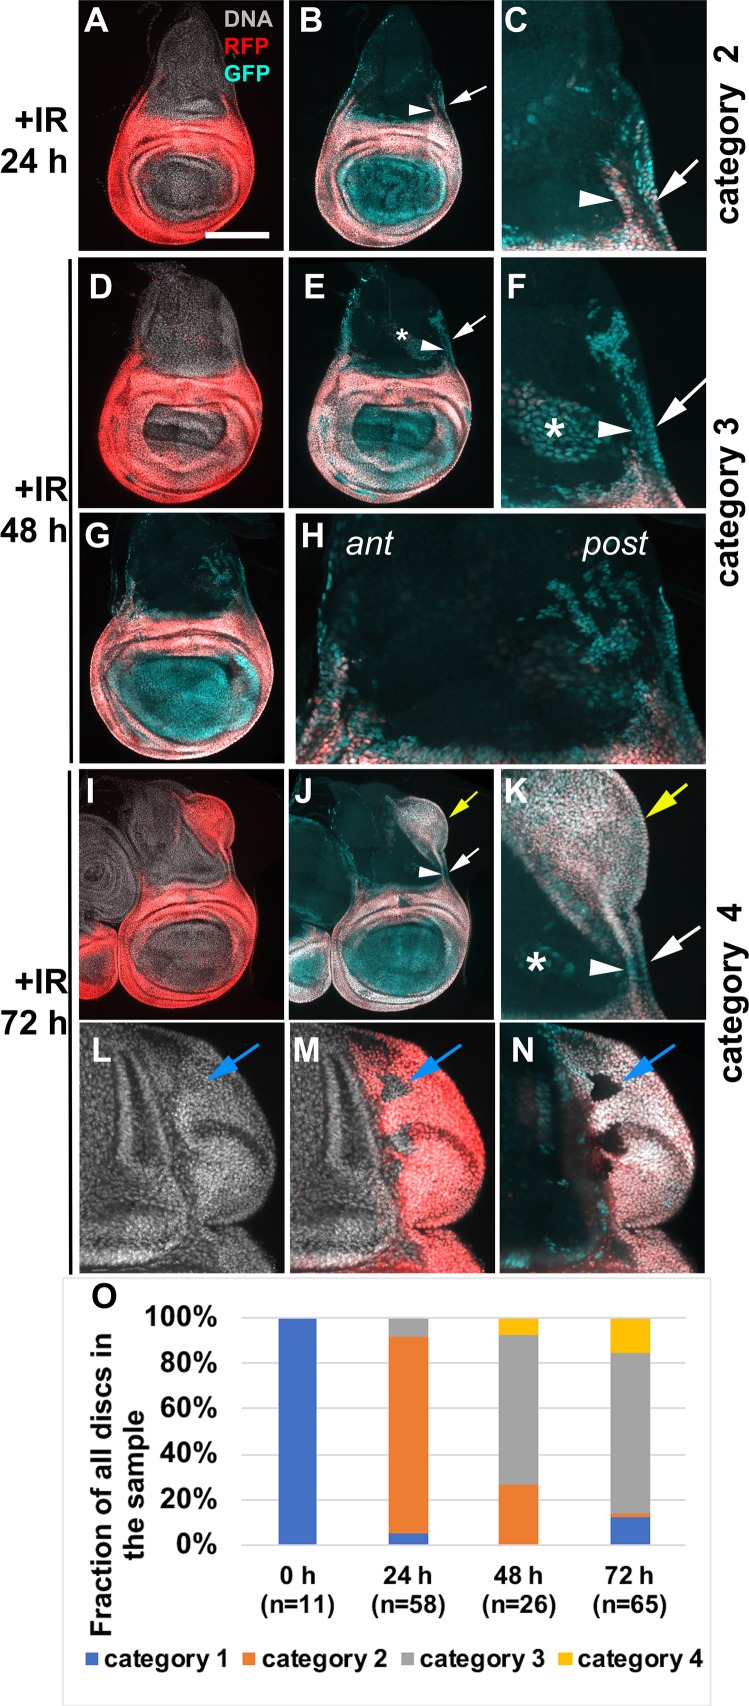
Fig 3. R73G07-GAL4>G-trace in a time course.
Larvae of the genotype UAS-G-trace/+; GAL80ts/ R73G07-GAL4 were treated as in Fig 1M. Wing discs are removed, fixed and imaged for RFP/GFP at 24, 48 and 72 h after IR. The discs were also stained for DNA. All discs are shown with anterior left and dorsal up. Panels C, F, H and K show magnified portions of the disc preceding it. L-N show the ectopic disc from another 72 h disc. Arrowheads = GFP+ cell populations in the notum that are contiguous with the hinge. White arrows = GFP+ cell populations in the notum that are contiguous with the pleura. Yellow arrows = ectopic discs. Blue arrows = cells within ectopic discs that lack GFP or RFP. * = cells outside the columnar epithelial layer that express G-trace. (O) The disc were categorized according to the extent of GFP/RFP cells in the notum as described in the text; for example, Fig 2A–2D for category 1, Fig 3A–3C for category 2, Fig 3D–3H for category 3 and Fig 3I–3K for category 4. n = the number of discs analyzed for each time point, in two independent cohorts of larvae. Scale bar = 33 microns in C, F, H, K, L-N, and 100 microns in the rest of the panels.

