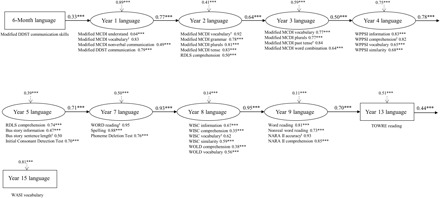
Fig. 1. Study 1.

Standardized solution for stability model (N = 925). Numbers associated with single-headed arrows are standardized path coefficients; numbers associated with dotted single-headed arrows are error variances or disturbances, the amount of variance not accounted for by paths in the model. Indicators of each latent variable are listed below the latent variable with their factor loadings. †Marker indicators of the latent factors (loadings set to 1 to scale and identify the factor). Covariances that were in the model, but not shown in the figure, included year 2 MCDI vocabulary and RDLS comprehension, standardized coefficient = 0.22, P < 0.001; year 5 RDLS comprehension and Initial Consonant Detection Test, standardized coefficient = −0.26, P < 0.001; year 5 Bus Story information and Bus Story sentence length, standardized coefficient = 0.78, P < 0.001; and year 9 word and nonreal word reading, standardized coefficient = 0.39, P < 0.001. Correlations of 0.10, 0.30, and 0.50 correspond to small, medium, and large effect sizes, respectively (78).
