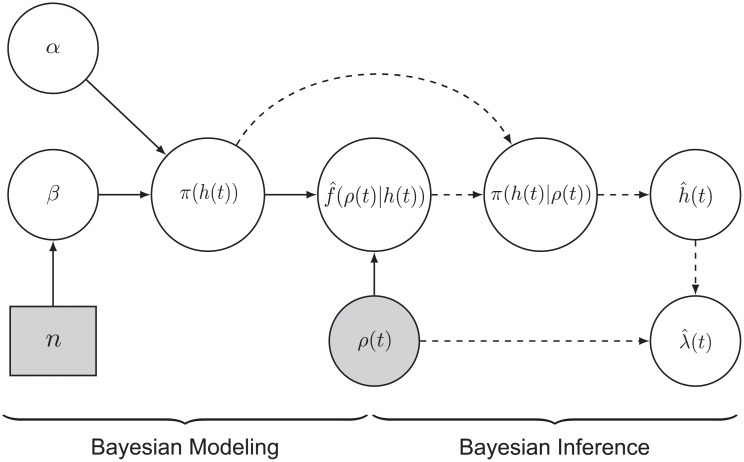
Fig 1. Graphical representation of BAKS.
The various blocks describe the different components as follows: Circular blocks denote continuous variables, and rectangle blocks denote discrete variables. Shaded blocks represent observed variables, whereas white blocks represent hidden variables. Solid and dashed arrow indicate Bayesian modeling and inference phase, respectively.

