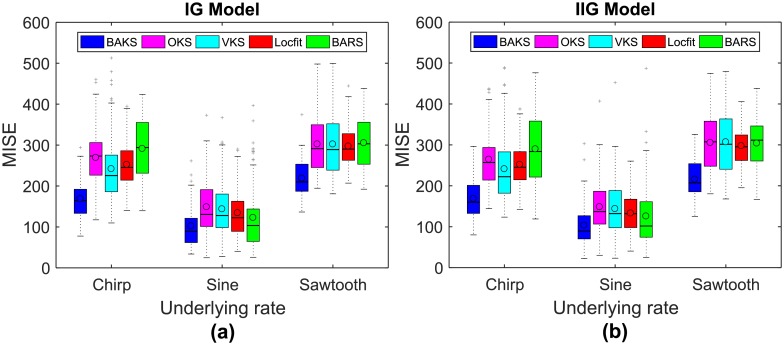
Fig 4. MISE comparison of BAKS with other methods.
(a) MISE comparison for three rate functions (chirp, sine, and sawtooth) from IG model. (b) MISE comparison for three rate functions (chirp, sine, and sawtooth) from IIG model. In each boxplot, black lines show the medians; black circles indicate the means; colored solid boxes represent interquartile ranges; whiskers extend 1.5× from upper and lower quartiles; gray crosses represent outliers.

