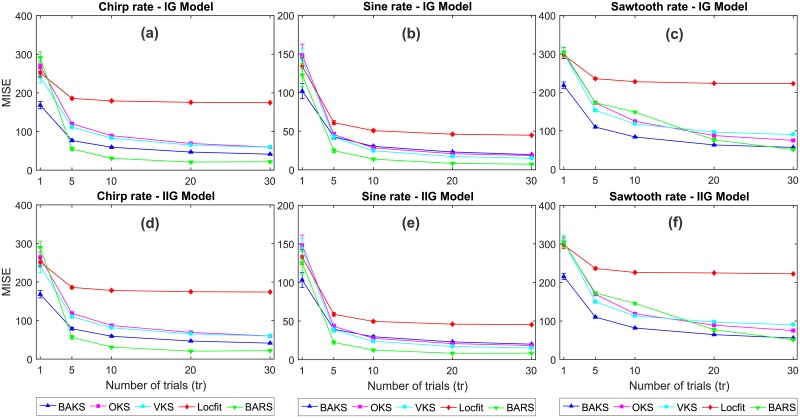
Fig 8. MISE comparison under different numbers of trials.
(a)-(c) MISE comparison for chirp, sine and sawtooth rate functions, respectively, for IG model. (d)-(f) MISE comparison for chirp, sine and sawtooth rate functions, respectively, for IG model. Vertical bars (not clearly seen for tr ≥ 5) represent the 95% confidence intervals.

