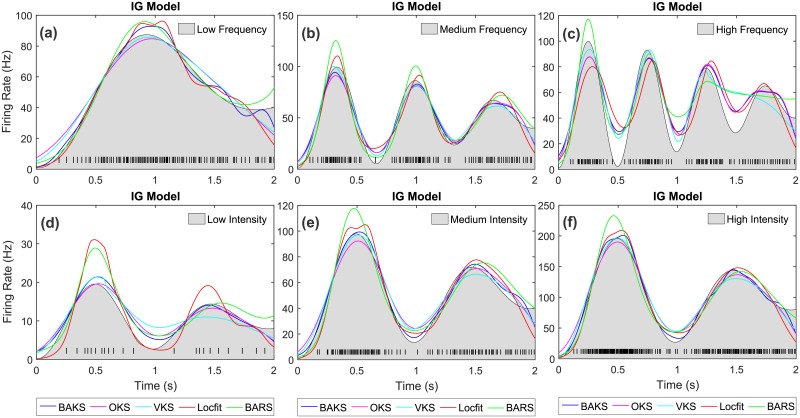
Fig 10. Firing rate estimate comparison for IG model with Gaussian-damped sinusoidal rate function.
(a)-(c) Firing rate estimates for the cases of low, medium and high frequency, respectively. (d)-(f) Firing rate estimates for the cases of low, medium and high intensity, respectively. Black lines with gray-shaded regions indicate the underlying rate functions. Black raster in the bottom of each plot represents a spike train generated from the associated underlying rate function.

