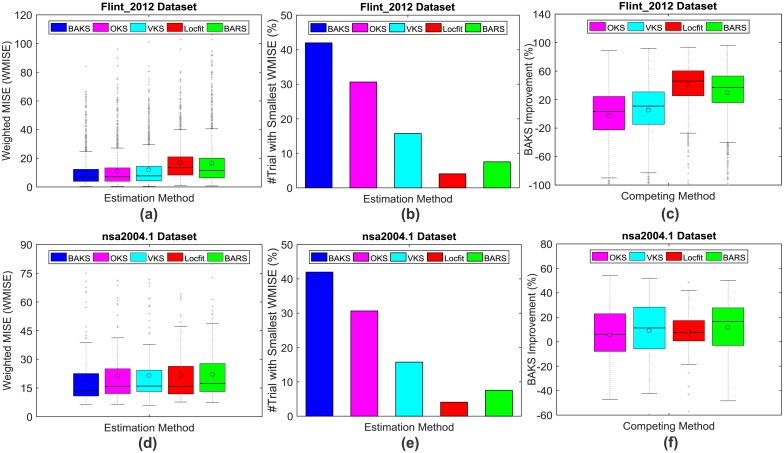
Fig 11. WMISE comparison across all firing rate estimation methods using real neural data.
(a) Average WMISE comparison across all trials in Flint_2012 dataset. (b) Number of times (in %) BAKS outperforms other methods in Flint_2012 datasets. (c) Single trial performance improvement made by BAKS over competing methods in Flint_2012 datasets. (d)-(f) Similar to that of (a)-(c) but with nsa2004.1 dataset. In each boxplot, black lines show the medians; black circles indicate the means; colored solid boxes represent interquartile ranges; whiskers extend 1.5× from upper and lower quartiles; gray crosses represent outliers.

