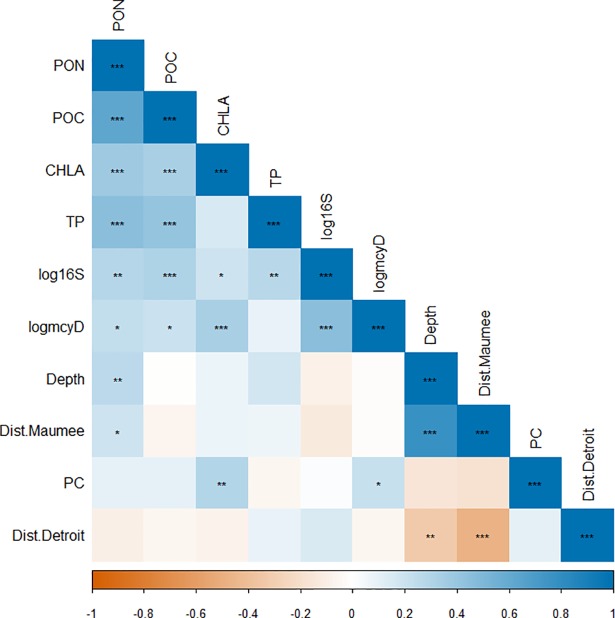
Fig 5. Correlation matrix of various parameters measured in the study.
Values of correlation coefficients are indicated by color and statistical significance of correlations are indicated by symbol (*: p<0.05, **: p<0.01, ***: p<0.001). Both total Microcystis (cell equivalents g-1) and potentially-toxic Microcystis (cell equivalents g-1) were log-transformed. The strength of correlation coefficients were assessed based on Cohen’s standard (i.e. correlation coefficients between 0.10 and 0.29 represent a weak association, coefficients between 0.30 and 0.49 represent a moderate association, and coefficients of 0.50 and above represent a strong association).

