
Fig 6.
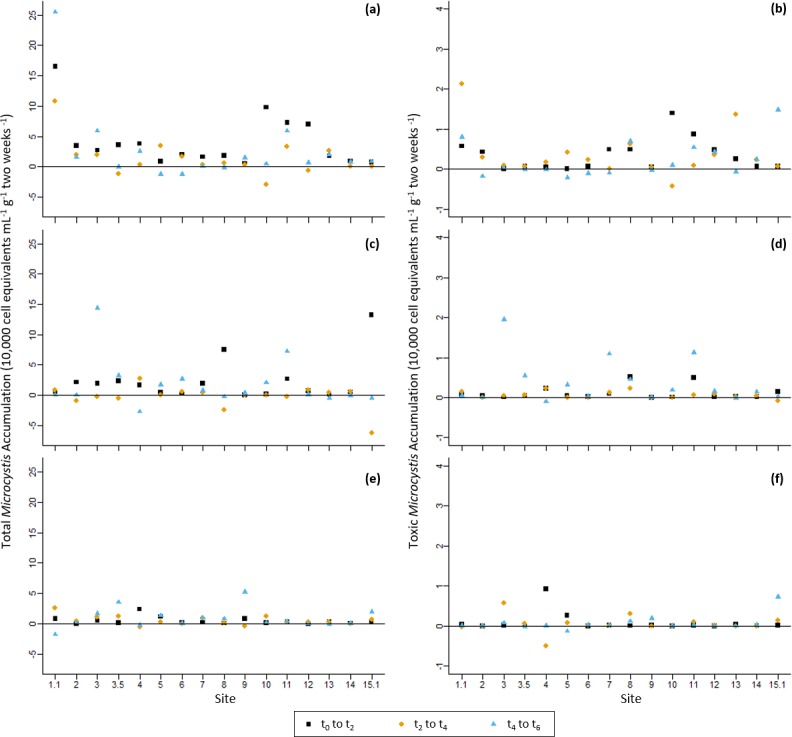
Log-transformed accumulation data for April 2015 cultures for a) total Microcystis and b) potentially-toxic Microcystis, November 2015 cultures for c) total Microcystis and d) potentially-toxic Microcystis, and April 2016 cultures for e) total Microcystis and f) potentially-toxic Microcystis, all in terms of change in cell equivalents mL-1 g-1 2 weeks-1. Squares represent accumulation from t0 to t2, diamonds represent accumulation from t2 to t4, and triangles represent accumulation from t4 to t6.