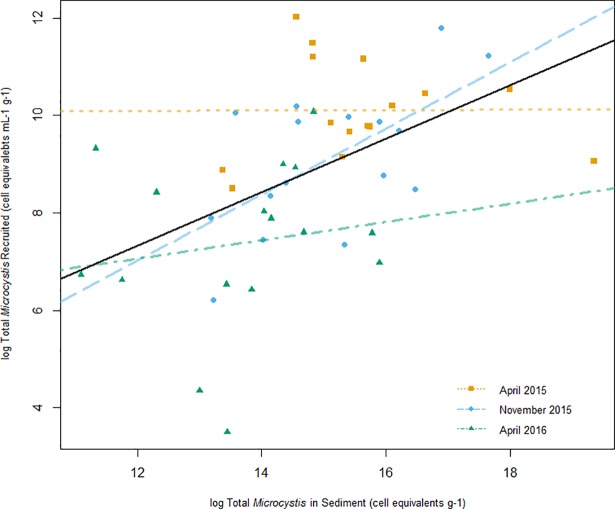
Fig 7. Microcystis vitality plotted against Microcystis abundance.
The amount of total Microcystis in overlying water at t2 (log cell equivalents mL-1 g-1) plotted against Microcystis sediment abundance (log cell equivalents g-1). Values at t2 were used to minimize the impacts of sampling dilution and influences of growth. The plot shows simple linear models for April 2015 data (dotted line), November 2015 data (dashed line), April 2016 data (dot-dashed line), and for overall data (solid line).

