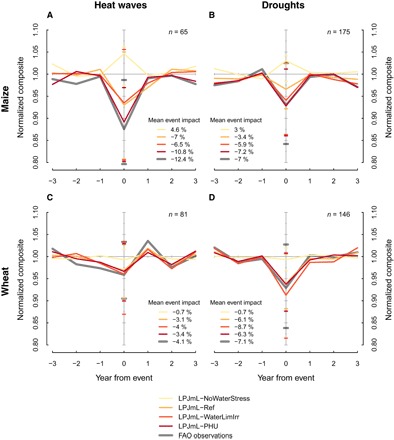
Fig. 2. Observed and simulated influences of extreme weather on global crop yields.

Global average impact of heat waves (first column) and droughts (second column) on maize (top row) and wheat (bottom row) yields [1964–2007; all events recorded in EM-DAT (13)]. Composites are based on 7-year time windows of country-level yields centered on the respective event. Results are shown for observed FAO time series (gray) and for different LPJmL simulations (yellow to red; see Table 1). Dashes along the y axis indicate the 25th to 75th percentile range of both observations and simulations at the event year. The number of composited events is indicated in the top-right corner (n); for details, see the “Statistical analysis” section and table S3 for the list of considered extreme events.
