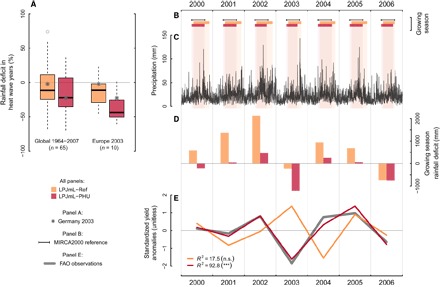
Fig. 3. Effects of growing season adjustment on maize rainfall deficit.

Boxplots in (A) highlight the national relative rainfall deficit during heat waves for LPJmL–Ref and LPJmL–PHU simulations, separated for all occurrences (1964–2007, n = 65) and Europe 2003 (n = 10). Rainfall deficit is calculated as the relative difference between simulated growing season precipitation and the long-term average precipitation during the reference growing season. The Germany 2003 case is indicated with asterisks (A) and detailed through (B) to (E): Effect of the growing season timing [(B), MIRCA2000 reference in black] on precipitation exposure [(C), PGFv2.1 forcing], rainfall deficits (D), and standardized yield anomalies (E) from 2000 to 2006. Results for LPJmL–Ref and LPJmL–PHU are shown in orange and red, respectively, and FAO observations are shown in gray. The fraction of the explained variance in yield anomalies (R2, in percent) is indicated in the bottom with statistical significance in parentheses (*** if P < 0.001; n.s. (not significant) if P ≥ 0.1).
