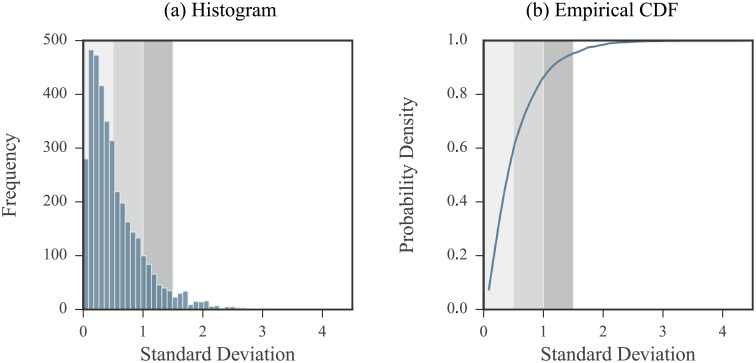
Fig 3. Log domain standard deviation values of measurements coming from real SHAPE data.
Standard deviation values were calculated for each nucleotide on log measurements. (a) Histogram of standard deviation values. (b) Empirical CDF of standard deviation values. The shaded regions correspond to our definition of low, medium, and high noise regimes. All non-positive measurements were removed from the initial set of data. Nucleotides with a single positive measurement were excluded so that a total of 3723 data points were considered.

