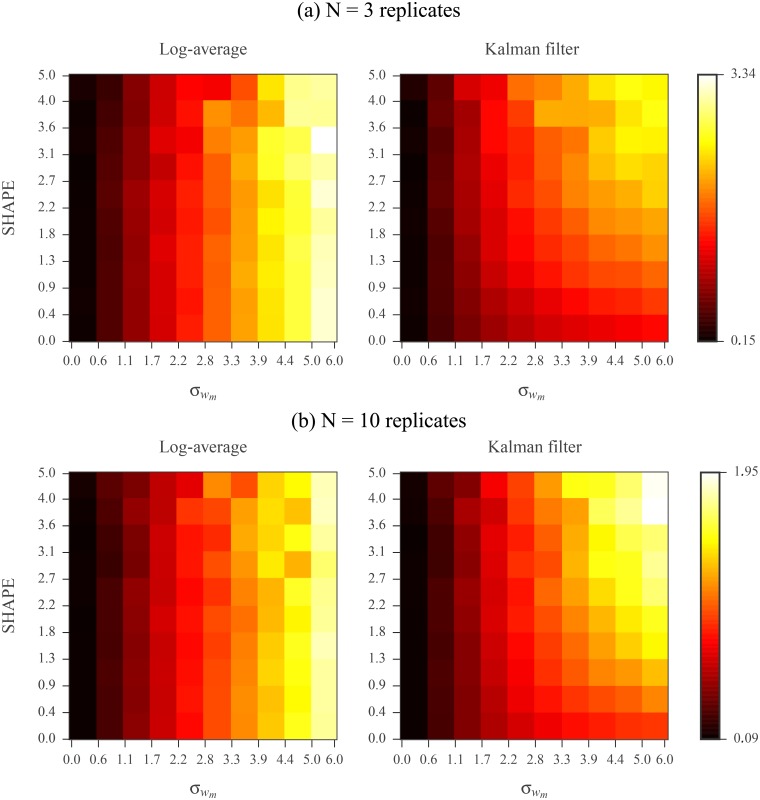
Fig 4. Comparison of log-averaging and Kalman filtering using (a) N = 3 and (b) N = 10 simulated replicates under log-normal noise model.
The vertical axis represents the data domain ground truth reactivity, sm. The horizontal axis represents the log domain standard deviation of the simulated measurements, . Nucleotides were binned based on sm and values. Left panel shows RMS errors calculated between ground truth and log-averaged reactivities for all nucleotides in a bin. Right panel shows RMS errors calculated between ground truth and Kalman filtered reactivities for all nucleotides in a bin. Error calculations were carried out in the log domain and ground truth values were the log reactivities. See Methods for RMS calculation details.

