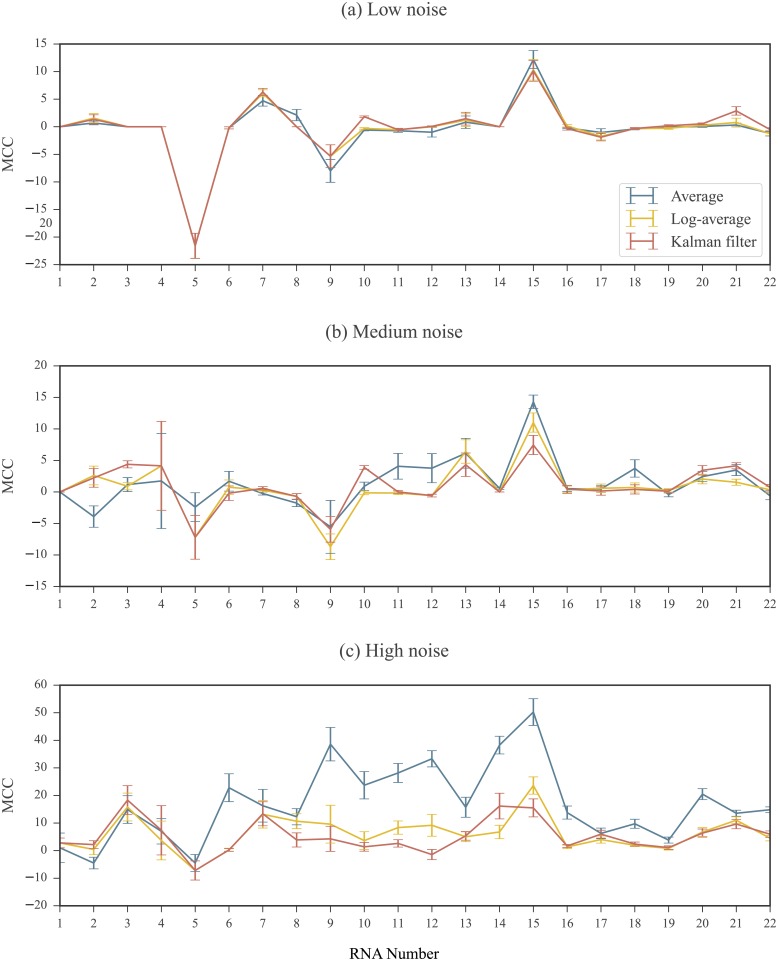
Fig 9. RNAstructure results for profiles calculated using different processing methods.
3 replicates simulated at (a) low (b) medium and (c) high noise regimes. MCC differences are plotted compared to the baseline calculated in SET0. An MCC difference of 0 indicates that when the processed profile was used as input to the RNAstructure software, the resulting predicted structure had the same accuracy as the one predicted using the ground truth profile as input. A positive MCC difference indicate that when the processed profile was input to to the RNAstructure software, the resulting predicted structure was less accurate than the one predicted using the ground truth profile as input. Note that the scale of the MCC differences vary between noise regimes. RNAs are ordered by length. See Table 1 of Methods for corresponding sequence names and lengths. Error bars represents standard errors over 10 repeated runs of replicate simulations.

