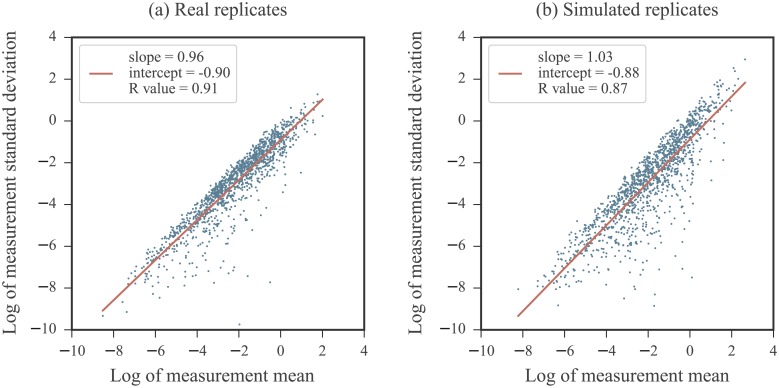
Fig 10. Comparison of mean-dependence in the standard deviation of (a) real and (b) simulated SHAPE measurements.
For each nucleotide, the mean value of the 5 measurements (real and simulated) were calculated and plotted against their standard deviation on a log-log plot. A linear fit is overlaid in red for each. The left panel is a recreation of Fig 1 for comparison. The right panel consists of data coming from simulated replicates for the same RNA. The ground truth reactivity used the in replicate simulation was the average measurement per nucleotide coming from the real replicates. For the simulated replicates, noise levels were between σmin = 0 and σmax = 1.5. Note that negative reactivity values in the real data are not included as they are incompatible with the log-log plot.

