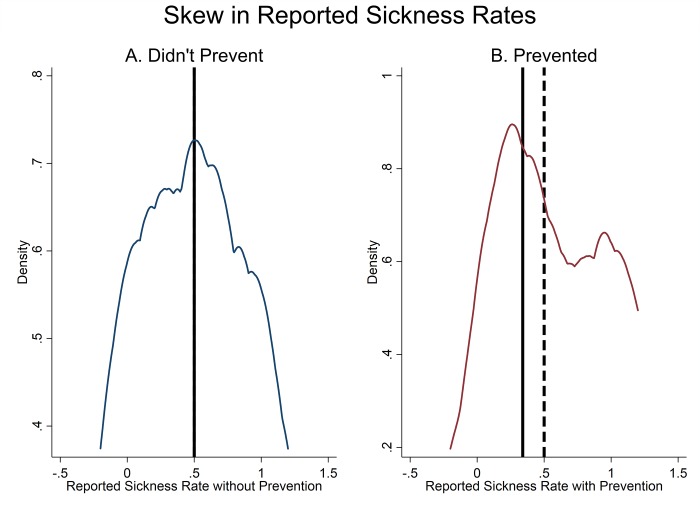
Fig 3. Reported illness rate with and without prevention.
Figure shows the distribution, by group, of reported illness rates when not preventing (Panel A) and when preventing (Panel B). Reported illness rates were re-scaled so that the expected probability of falling sick is 0.5 in the absence of prevention and 0.34 with prevention. In Panel A, sample is limited to the 55/177 (31%) groups who reported on non-prevention outcomes at least once, and in Panel B the sample is limited to the 97/177 groups (55%) who reported on prevention outcomes at least once. Solid line indicates expected illness rate while dashed line indicates the median reported illness rate (lines are overlapping in Panel A).

