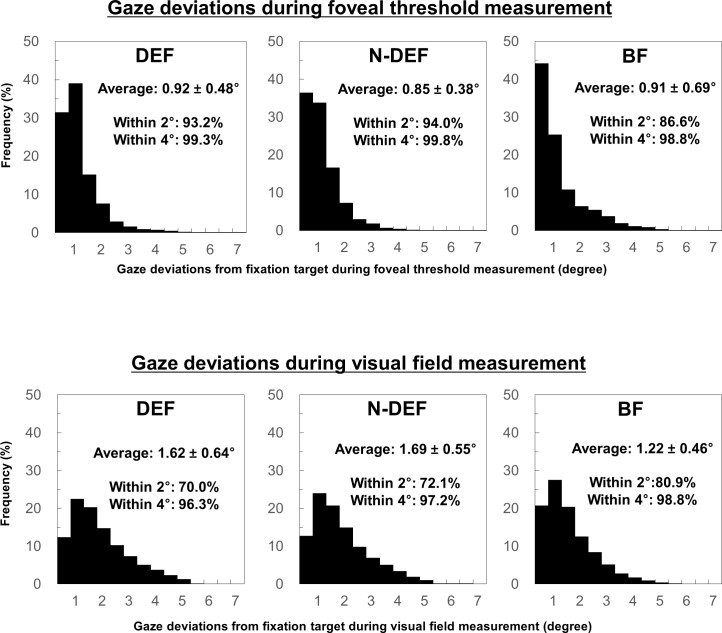
Fig 1. Frequency of gaze deviations from fixation target.
Histograms showing the frequency of gaze deviations during foveal threshold (upper) and visual field (lower) measurement in the dominant eye fixation (DEF), non-dominant eye fixation (N-DEF), and binocular fixation (BF) conditions. Data are given as mean ± standard deviation.

