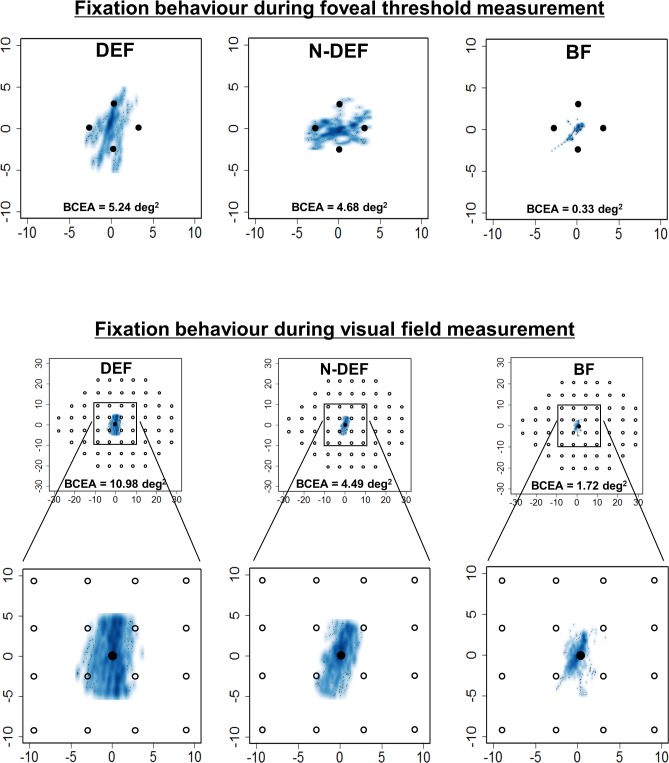
Fig 3. Typical examples of fixation variability.
Smooth scatter plots show typical examples of fixation variability during foveal threshold (upper) and visual field (lower) measurement in dominant eye fixation (DEF), non-dominant eye fixation (N-DEF), and binocular fixation (BF) conditions. Fixation variability of the visual field within 30° (upper) and 10° (magnified; lower) in visual field measurement. BCEA, bivariate contour ellipse area.

