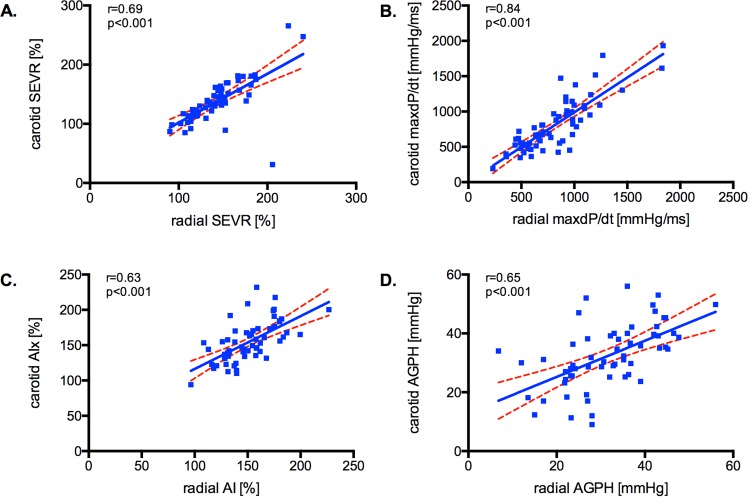
Fig 2. Correlation for PWA measures between peripheral measurement sites.
The results for the calculated parameters SEVR (A), dP/dtmax (B), AIx (C) and AGPH (D) are displayed. Linear regression was performed between the two peripheral measurement sites, 95% confidence intervals and the correlation coefficients are indicated.

