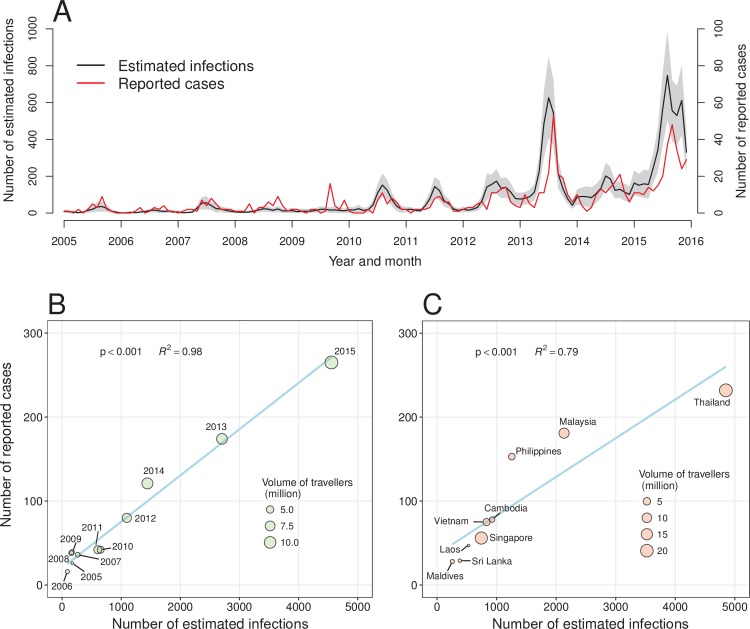
Fig 6. Estimates of imported DENV infections from nine SEA countries into China, 2005–2015.
(A) Time series of estimated infections in airline travelers, with 95% UI of estimates, and the reported cases imported from SEA. (B) Estimated infections vs reported cases by year. (C) Estimated infections vs reported cases by country. We estimated all symptomatic and asymptomatic infections that can possibly introduce transmission. In (B) and (C), symbol size is proportional to the volume of travelers from SEA into China, and blue solid lines represent linear regression fit, with p values and adjusted R-square values on the graphs.

