. 2018 Nov 14;7:e41115. doi: 10.7554/eLife.41115

Figure 1. Spatial distribution of fluoroquinolones in infected rabbit lung and lesions.

(a–b–c) Hematoxylin and Eosin (H and E) histology staining of lesions and surrounding lung tissue resected from rabbits that received a single dose of moxifloxacin (MXF) (a), levofloxacin (LVX) (b) or gatifloxacin (GTX) (c). N: necrotic core; white arrows: early caseating foci; yellow double arrows: cellular rim encompassing mostly lymphocytes, macrophages, foamy macrophages, interspersed epithelial cells and neutrophils. Panels d-e-f show the corresponding MALDI-MS ion maps of each drug in a tissue section adjacent to the one stained by H and E. Red arrows highlight the inner drug accumulation ring subtending the caseous core; yellow arrows highlight outer rings or pockets of higher drug abundance further outward from the core.

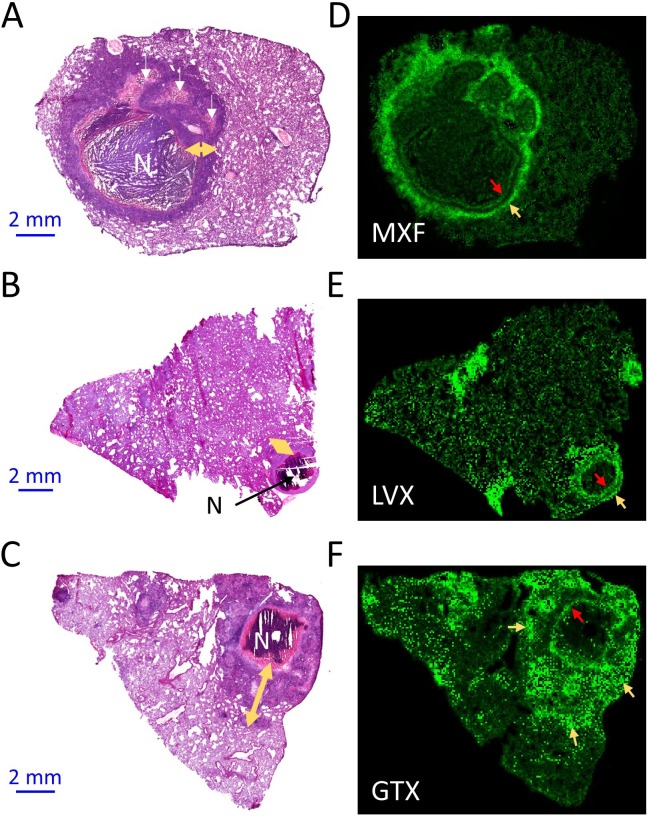
Figure 1.

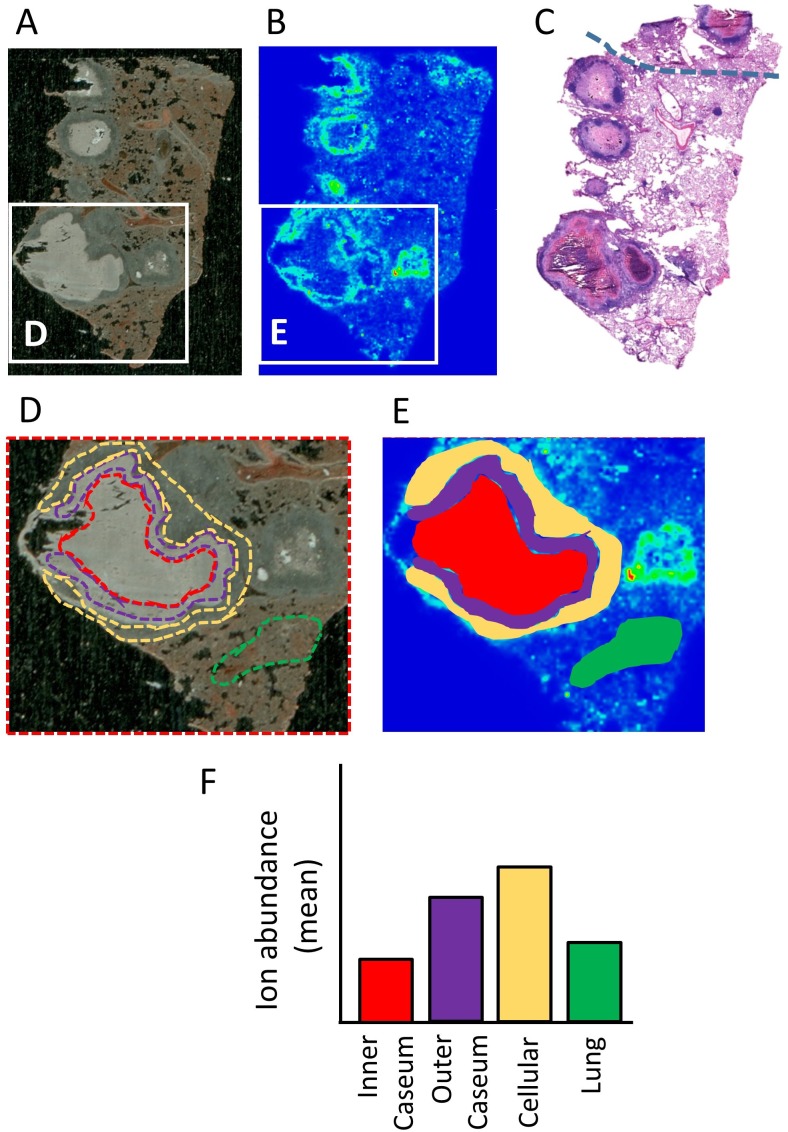
Figure 1—figure supplement 1. Schematic of the workflow for the relative quantitation of drug ions in specific areas delineated on MALDI ion maps.

Figure 1—figure supplement 1.

(A–B) Optical and MALDI MS images of one rabbit lesion section collected following a single dose of MXF. (C) H and E staining of the adjacent section showing the position of necrotic lesions. The grey dotted line indicates the region that ruptured upon sectioning in (A–B). (D) Areas that encompass uninvolved lung (green), cellular rim (yellow), outer caseum (purple) and inner caseum (red) are first delineated on the optical image. (E) The optical image and MALDI ion map are superimposed and each colored area is redrawn on the ion map. (F) The software Quantinetix from ImaBiotech (France) is used to quantify the signal intensity (ion abundance) of the drug of interest in each area.
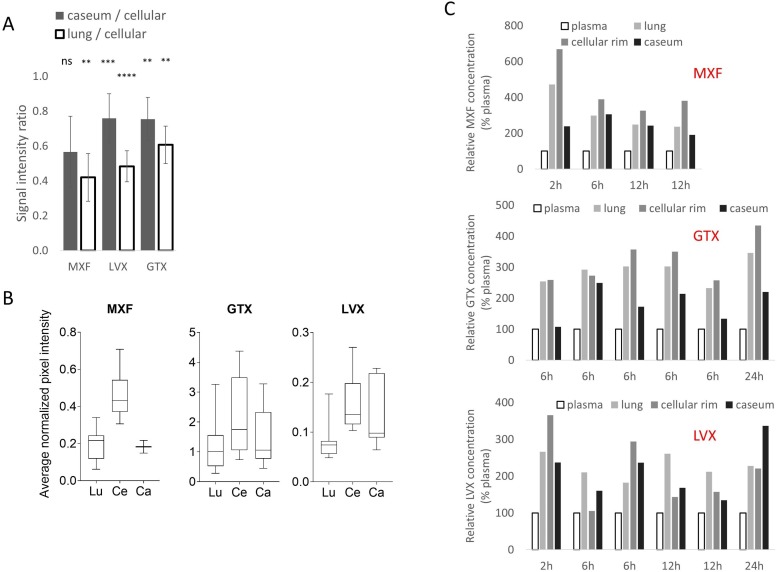
Figure 1—figure supplement 2. Relative quantitation of the fluoroquinolones in infected rabbit lung and lesion compartments.

Figure 1—figure supplement 2.

(A) Relative quantitation of moxifloxacin (MXF), levofloxacin (LVX) and gatifloxacin (GTX), in caseum and uninvolved lung relative to the cellular rim, determined from MALDI ion maps using ImaBiotech Software Quantinetix (v 1.7, Loos, France). Areas of interest encompassing uninvolved lung, cellular rim, and caseum were delineated by first aligning and superimposing the MALDI MS image over the optical scan of the tissue. The MS image layer was made transparent and the areas were drawn based upon the optical scan. The average drug abundance [ion count of drug/ion count of internal standard] ratios between caseum and cellular rim or uninvolved lung and cellular rim are shown. To detect statistically significant differences between signal intensities in lung versus cellular lesion, and cellular lesion versus caseum, the data were analyzed using the Wilcoxon matched-pairs signed rank test. *p<0.05, **p<0.01, ***p<0.001, ****p<0.0001. (B) Absolute measurements of average fluoroquinolone pixel intensities, normalized to internal standard, which were used to calculate the intensity ratios shown in (A). (C) Spatial quantitation of MXF, GTX and LVX in and around necrotic granulomas at different times following a single oral dose in rabbits with active TB, relative to plasma concentrations at the time of lesion dissection. Uninvolved lung tissue, cellular rim and central caseum of necrotic lesions were isolated by laser-capture microdissection and analyzed by HPLC coupled to mass spectrometry (LC-MS/MS). Plasma concentrations were determined by standard LC-MS/MS.