. 2018 Nov 14;7:e41115. doi: 10.7554/eLife.41115

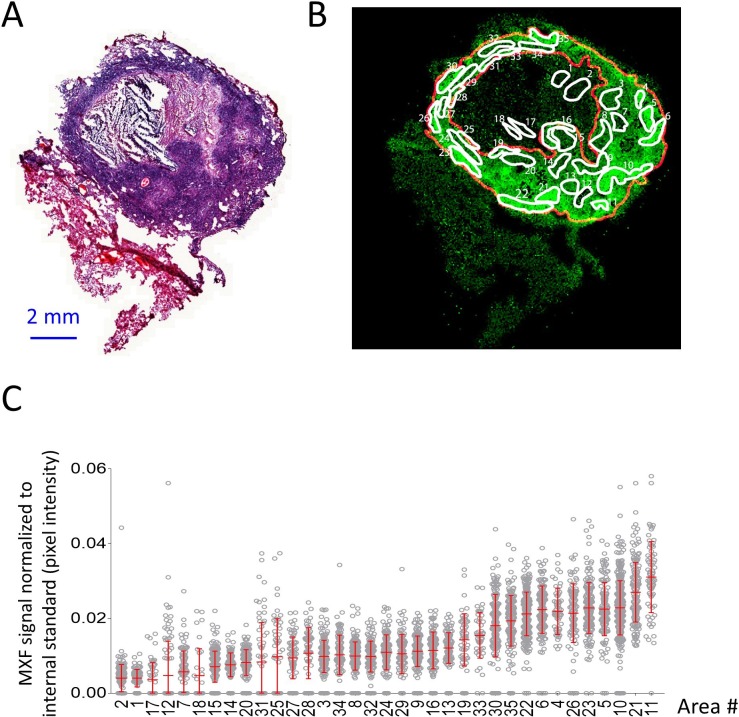
Figure 3. Heterogeneous distribution of MXF in the cellular cuff of a necrotic lesion.

(A) H and E staining of a cavitating necrotic granuloma. (B) Ion map of moxifloxacin (MXF) [M + H]+obtained by MALDI mass spectrometry imaging of the same section, according to the workflow and procedure described in Figure 3—figure supplement 4; (C) relative MXF abundance in 35 sub-areas delineated in the cellular rim of the MXF ion map shown in b (Contours of the 35 sub-areas are shown in Figure 3—figure supplement 2). Each dot represents the signal intensity of individual pixels in the ion map shown in (B). Pixel intensity mean and standard deviation are shown for each area. The number of pixel per sub-area ranged from 48 to 429 (48 < n < 429). Raw data can be found in Figure 3—source data 1).

Figure 3—source data 1. Histology and drug abundance (Figure 3) parameters in the 35 regions of interest, used in the covariate search and nonlinear correlation analysis (Figure 4).
DOI: 10.7554/eLife.41115.012
Figure 3—source data 2. Spearman rank correlation, showing positive association between MXF abundance and the fraction of macrophages, and inverse correlation with relative distance from lesion border and necrosis fraction.
DOI: 10.7554/eLife.41115.013

Figure 3.

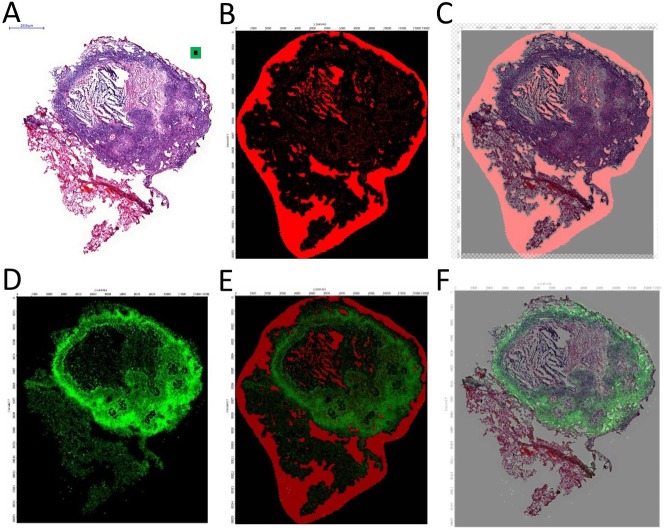
Figure 3—figure supplement 1. Workflow for overlaying MALDI-MSI and histology images.

Figure 3—figure supplement 1.

(A) H and E stained tissue, obtained from the same section used for MALDI MS imaging, after washing of the DHB matrix; (B) Map of matrix ion m/z 362,217, a matrix-related peak highly abundant outside of the tissue and used to revealed contours of the tissue border and hollow bronchioles within; (C) Alignment of the matrix ion and H and E images; (D) Moxifloxacin [M + K]+ion image (m/z 440,138 normalized to internal standard MXF-d4 m/z 444,1638); (E) Normalized MXF image aligned with the matrix marker image using the Thermo ImageQuest image ruler; (F) MXF intensity map aligned and overlaid with H and E image of the same section.
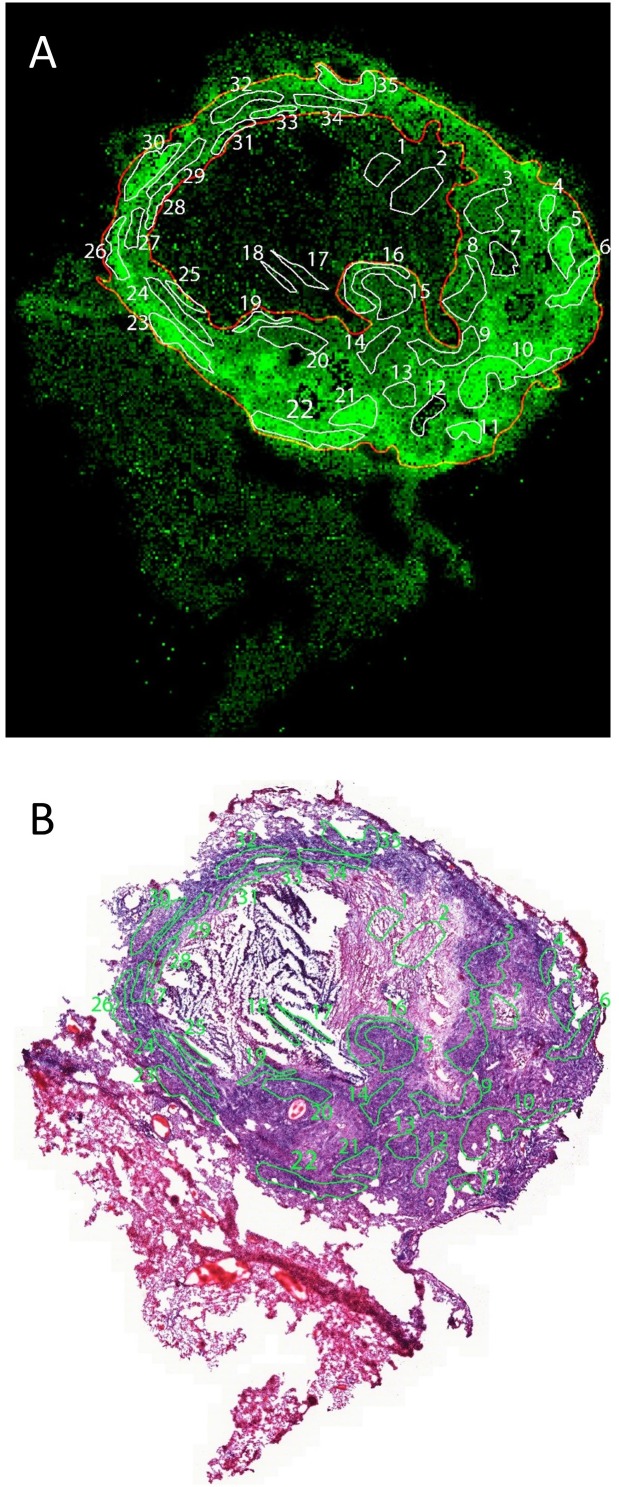
Figure 3—figure supplement 2. Regions of interest in MALDI-MSI MXF ion map (A) and histology staining (B) of the same section.

Figure 3—figure supplement 2.

Thirty-five ROIs were delineated on the MXF ion map and superimposed onto the image of the H and E stained section as described in Blanc et al., 2018.
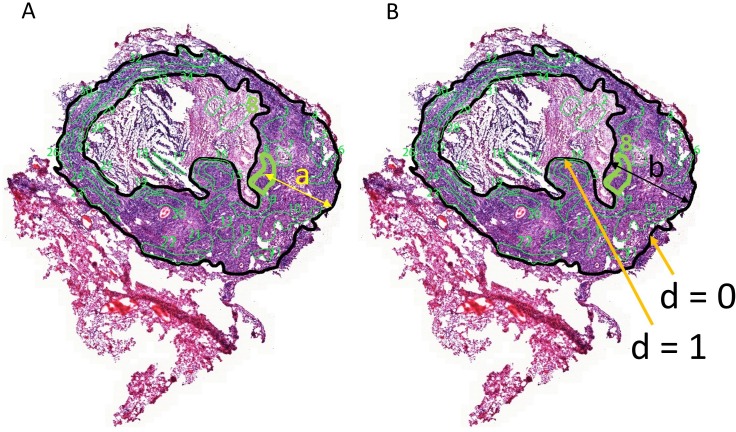
Figure 3—figure supplement 3. Correlations between MXF abundance, distance to edge of granuloma and cell types.

Figure 3—figure supplement 3.

(A–B) Description of the method used to measure the distance of each area to the outer edge of the granuloma, relative to the total distance between the inner and outer edges of the cellular rim (d = a/b). This measure was used since the thickness of the cellular rim is not constant, and vascular efficiency was shown to decrease as the distance from granuloma edge increases (Datta et al., 2015). Region #8 is used to illustrate the method. (A) Distance a (yellow arrow) was measured from the centroid (https://en.wikipedia.org/wiki/Centroid#Centroid_of_polygon) of each area to the nearest point on the outer edge (black contour line) of the granuloma. (B) A straight line was then drawn from the nearest point on the outer edge, through the centroid, and all the way to the inner edge of the cellular rim (black contour line), at the border with caseum (black arrow, distance b). The ratio between a and b was used as the relative distance to the outer border of the granuloma, a surrogate of vascular efficiency. Thus d is maximum (=1) at the cellular/caseum interface, and d = 0 at the outer edge of the granuloma.
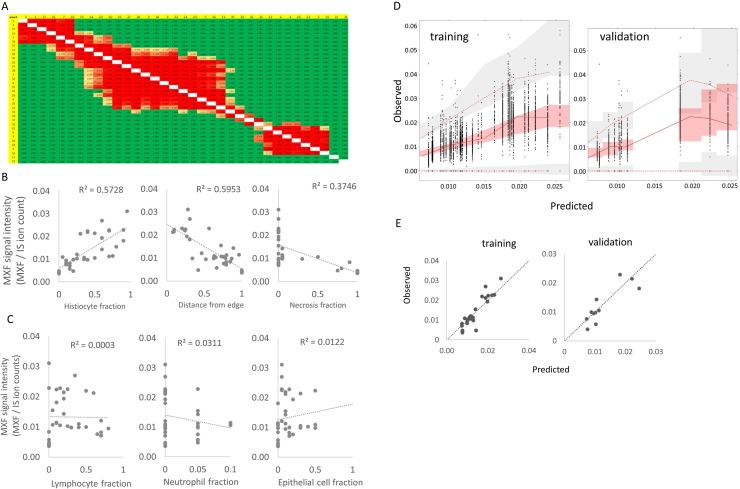
Figure 3—figure supplement 4. Identification of the drivers of moxifloxacin distribution in cellular lesion compartments.

Figure 3—figure supplement 4.

(A) Statistical analysis of MXF relative abundance per area: average pixel intensities in each ROI were compared using a one-way analysis of variance (ANOVA) comparing the mean MXF pixel intensity in each of the 35 areas, and a Tukey post-hoc test for multiple comparisons. The number of pixels per ROI ranged from 48 and 429. Green cells indicate comparisons with p≤0.05. (B) Plots of the Spearman rank correlations between MXF abundance and the fraction of histiocytes (including macrophages and foamy macrophages), relative distance of ROI to granuloma edge and fraction of necrosis. The method used to measure the relative distance of each sub-area to granuloma edge, a surrogate of vascular efficiency, is described in Figure 3—figure supplement 3. (C) Plots of Spearman rank correlations between MXF abundance and fraction of lymphocytes, neutrophils, and epithelial cells. (D) Visual Predictive checks of the final model developed on the training dataset (left), and internal validation showing predicted MXF abundance using ROI-specific measurements of histiocytes, distance ratio and % necrotic cells in the final model equation. MXFabundance=θ1×eθ2×(Histiocytes%-0.35)×eθ3×(DistanceRatio-0.65)×(1+θNecrosis) where θ1-3andθnecrosis are model estimated constants and are reported in supplementary file 1 The lines and shaded areas in D are as follows: continuous red line: observed data median; dotted red line: 5th and 95th percentile of the observed data; light red shaded area: predicted median with uncertainty; light grey shaded area: predicted percentiles of the data with uncertainty. (E) Visual Predictive Checks (VPC) similar to the plots described in (D) but showing only the median signal intensity for each ROI. Dotted line: line of identity.