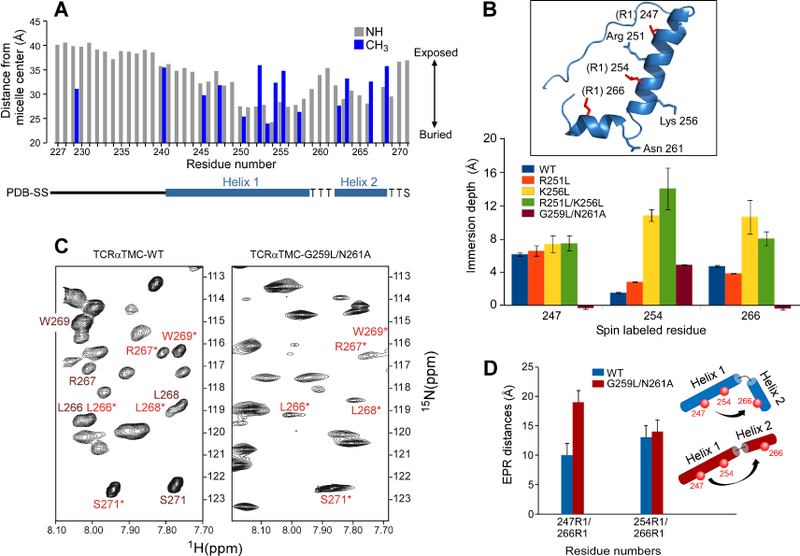
Figure 2. TCRα membrane depth analysis and generation of a straightened helix.

A) The 15N backbone resonances (grey) and 13C-methyl ILV resonances (blue) NMR determined membrane distance information of the TCRαTMC in LPPG micelles measured by a PRE-based analysis. A secondary structure diagram is shown below the x-axis. Residue 267 has been omitted due to spectral overlap.
B) EPR spin-labeled residues (R1) 247, 254, and 266 were used to determine the liposome immersion depths for singly labeled WT and mutant TCRα segments. Inset: Ribbon representation of the structurally determined TCRαTMC with spin-labeled residues (R1) in red and residues mutated for depth analysis highlighted in blue. Gly259 is not shown.
C) An expanded region of the 1H-15N HSQC spectra of the TCRαTMC WT (left) and the TCRαTMC G256L/N261A mutant (right). Resonances undergoing exchange in the WT segment are labeled in dark red and in light red with an asterisk. In the G256L/N261A mutant, those remaining peaks are labeled in light red with an asterisk.
D) The EPR measured distances calculated for the TCRαTMC WT (blue) and G259L/N261A mutant (red) segments in liposomes plotted as distance versus residue numbers of the spin labeled pairs. A cartoon illustrating the position of the spin labels (red spheres) and relative orientation of Helix 1 to Helix 2 is shown for the WT segment (blue) and G259L/N261L segment (red).
