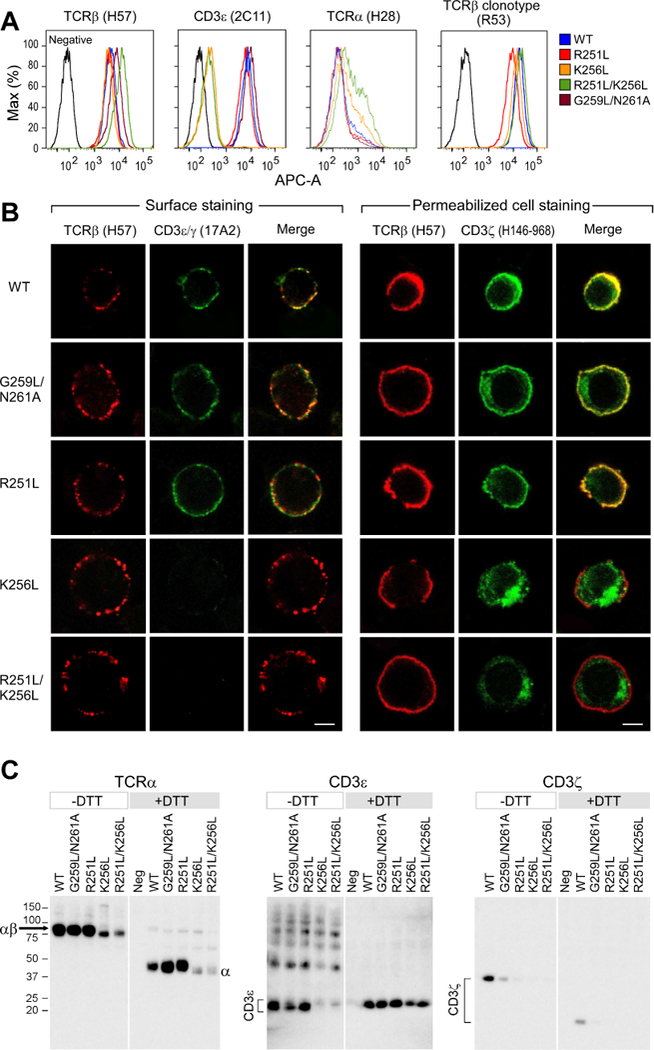
Figure 3. Biochemical analysis and surface membrane expression of TCR complex subunits in T cells transfected with wildtype versus mutant TCRα.

A) Flow cytometry analysis of the TCRβ, CD3ε, and TCRα cell surface expression using the indicated mAbs for each WT or variant TCRα chain containing cell line.
B) Confocal microscopy immunofluorescence analysis of the TCR components in the WT and mutant TCRα cell lines. A Z-plane representative slice is shown for each line with TCRβ, CD3εγ and a merge of the combined TCRβ (red) and CD3εγ (green) antibody cell surface staining results. Permeabilized cell staining results are shown for TCRβ (red) and CD3ζ (green) antibody intracellular staining of each cell line and a merge. Co-localization in merge appears as yellow in surface and intracellular staining. Bar = 5μm.
C) Immunoblot analysis of the TCRα, CD3ε, and CD3ζ co-immunoprecipitated with anti-TCRβ and run under reducing (+DTT) and non-reducing (-DTT) conditions.
