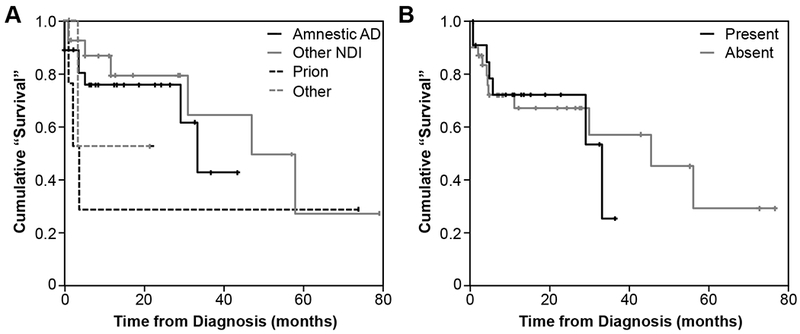
Figure 2:

Kaplan-Meier ‘survival’ curves. A. Depicting time from diagnosis to death or severe dementia (CDR 3), stratified by clinical diagnosis. B. Depicting time from diagnosis to death or severe dementia (CDR 3), stratified by the presence or absence of secondary diagnoses. Events were defined as death or the development of severe dementia (CDR 3). Participants lost to follow-up were censored at the time of their last assessment. No differences were noted in time to outcome across groups (log-rank statistics, p>0.05).
