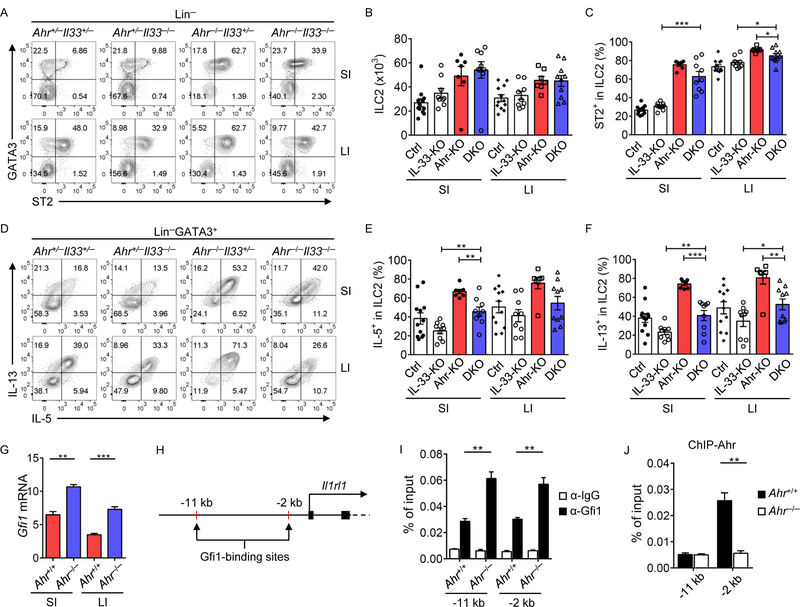
Figure 5. Ahr negatively regulates ILC2 function through IL-33-ST2 pathway and suppresses Gfi1 recruitment to the Il1rl1 locus.

(A to F) FACS analyses of ST2 and GATA3 expression after gating on Lin− cells (A), and IL-5 and IL-13 expression after gating on Lin−GATA3+ cells (D) in the small intestine (SI) and large intestine (LI) of littermate mice of indicated genotypes. Data are representative of nine independent experiments. Absolute numbers of ILC2s (Lin−GATA3+) (B), percentages of ST2+ (C), IL-5+ (E), and IL-13+ (F) cells in ILC2s (Lin−GATA3+) in SI and LI of littermate mice of indicated genotypes (Ctrl: Ahr+/+ or Ahr+/−; IL-33 KO: Il33−/−; Ahr KO: Ahr−/−; DKO: Ahr−/−Il33−/−). Data are shown as mean ± SEM (n=7–12 per group). (G) mRNA of Gfi1 in ILC2s of littermate Ahr+/+ or Ahr−/− mice was determined by realtime RT-PCR. Data are representative of two independent experiments, and are shown as mean ± SEM (n=3). (H) Gfi1-binding sites at the Il1rl1 locus identified by ChIP-seq. (I and J) ILC2s from LI of littermate Ahr+/+ or Ahr−/− mice were expanded in vitro, and subjected to Gfi1 or Ahr ChIP assay. Enrichment of Gfi1 (I) or Ahr (J) at the Il1rl1 locus was determined by real-time PCR. Data are representative of two independent experiments, and are shown as mean ± SEM (n=3). Rabbit IgG isotype antibody was used as a negative control.
