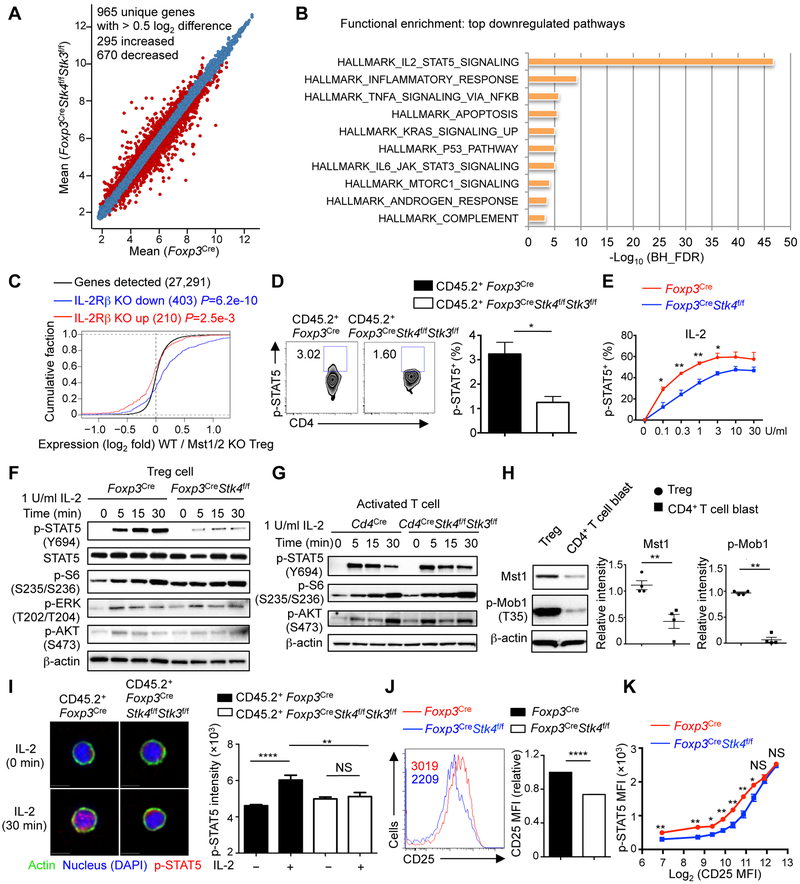
Figure 3. IL-2 target gene expression and STAT5 activation are reduced in Mst1–Mst2-deficient Treg cells.
(A) Number of differentially expressed genes (> 0.5 log2 difference) from the transcriptome analysis of WT and Mst1–Mst2-deficient Treg cells isolated from mixed BM chimeras (Foxp3Cre, n = 5; Foxp3CreStk4f/fStk3f/f, n = 4). (B) Functional enrichment of downregulated genes in Mst1–Mst2-deficient Treg cells using the Hallmarks database (MSigDB). BH_FDR, Benjamini-Hochberg false positive rate. (C) Empirical cumulative distribution function for the change in expression (log2 values) of all genes (black line) expressed in WT Treg cells (change relative to that in Mst1–Mst2-deficient Treg cells) and for subsets of genes upregulated (red line) or downregulated (blue line) by IL-2Rβ deficiency in Treg cells (Yu et al., 2009). (D) Flow cytometry analysis and statistics of p-STAT5+ cell frequency in WT and Mst1–Mst2-deficient YFP+ Treg cells from mixed BM chimeras (n = 4). Numbers in gates indicated percentage of cells. (E) Statistics of p-STAT5+ cell frequency in WT or Mst1-deficient Treg cells (n = 3) stimulated with IL-2 for 30 min. (F) Immunoblot analysis of p-STAT5, STAT5, p-S6, p-ERK and p-AKT in WT and Mst1-deficient Treg cells upon 1 U/ml IL-2 stimulation. (G) WT or Mst1–Mst2-deficient naïve CD4+ T cells (from Cd4Cre or Cd4CreStk4f/fStk3f/f mice) were stimulated by plate-bound anti-CD3-CD28 for 3 days and rested for another 3 days in IL-2 to generate T cell blasts. T cell blasts were rested without IL-2 for 8 h at 37°C followed by 1 U/ml IL-2 stimulation, and analyzed by immunoblot. (H) Activated CD4+ T cell blasts were generated as in (G). Mst1 protein and p-Mob1 were examined in activated T cell blasts and freshly isolated Treg cells from WT mice by immunoblot (n = 4). (I) Representative images of p-STAT5 nuclear translocation in WT and Mst1–Mst2-deficient Treg cells from mixed BM chimeras in response to IL-2 stimulation for 0 and 30 min (left). Right, quantification of p-STAT5 nuclear immunofluorescence signal in WT and Mst1–Mst2-deficient Treg cells with IL-2 stimulation for 0 and 30 min (n > 30). (J) Flow cytometry analysis and statistics of CD25 expression on WT and Mst1-deficient Treg cells (n = 4). Numbers in graph indicate MFI. The relative CD25 MFI was calculated by normalizing the value in WT Treg cells to 1. (K) Statistical analysis of p-STAT5 vs. CD25 expression in WT and Mst1-deficient Treg cells upon 1 U/ml IL-2 stimulation for 30 min (n = 3). Data in plots indicate means ± s.e.m. NS, not significant; *P < 0.05, **P < 0.01, ****P < 0.0001; two-tailed unpaired Student’s t test (D, E, H, J, K), one-way ANOVA (I). Data are from one experiment (A–C), representative of at least 2 independent experiments (D, F–J) or pooled from 3 experiments (E, K). See also Figure S3.

