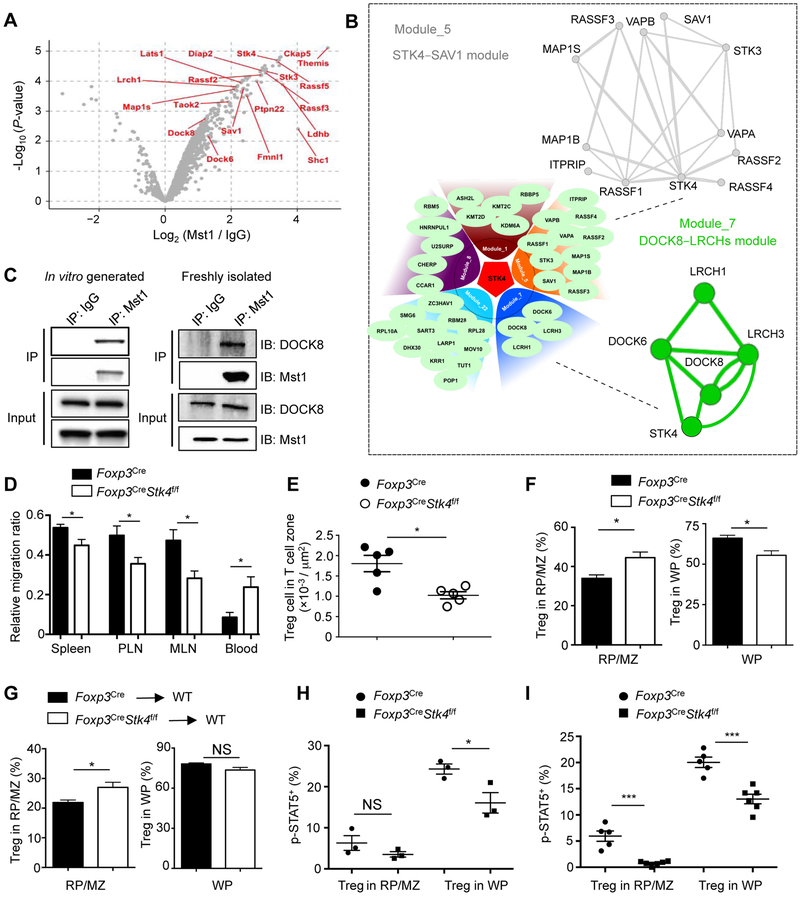
Figure 6. Mst1 is associated with the DOCK8–LRCHs module in Treg cells and promotes access to IL-2 in vivo.
(A) Volcano plot of log2 (fold change) and log10 (P-value) to compare proteins identified in the immunoprecipitates by Mst1 antibody vs. IgG control, with the selective Mst1-interacting proteins annotated. (B) Protein-protein interaction modules mediated by Mst1. Lower left, five of the largest modules found in the Mst1 interactome; upper right, a closer view of the STK4–SAV1 module; and lower right, a closer view of the DOCK8–LRCHs module. Detailed information of all modules is listed in Table S2. (C) Immunoblot of DOCK8 and Mst1 after immunoprecipitation with IgG or Mst1 antibody or total extracts (input) of in vitro-derived Treg cells and freshly isolated Treg cells (after expansion by IL-2–α-IL-2 complex). (D) WT or Mst1-deficient YFP+ Treg cells (5×10⁵) from Foxp3Cre and Foxp3CreStk4f/f mice were adoptively transferred into WT congenic CD45.1+ mice (n = 6), together with 1×10⁶ CD45.2+CD8+ T cells (for normalization). After 5 h, the ratio of CD45.2+CD4+ Treg cells vs. CD45.2+CD8+ T cells was analyzed in spleen, PLN, MLN and blood and then normalized with the starting ratio before transfer (1:2). (E) Spleens of young (< 6 weeks old) Foxp3Cre and Foxp3CreStk4f/f mice were analyzed by immunofluorescence. Splenic T cell zone was determined by regions inside of T cell zone (CD3+ rich), circumscribed by B220+ cell-rich marginal zone. Quantification of YFP+ Treg number per area of T cell zone (n = 5) is shown. (F) After in vivo T cell labeling with CD4-PE, splenocytes of Foxp3Cre and Foxp3CreStk4f/f mice were analyzed by flow cytometry for YFP-Foxp3 and CD4-PE expression. Frequencies of YFP+ Treg cells (n = 3) labeled in vivo with CD4-PE (in red pulp/marginal zone (RP/MZ)) and not labeled with CD4-PE (in white pulp (WP)) are shown. (G) WT or Mst1-deficient YFP+ Treg cells (1×10⁶) from Foxp3Cre and Foxp3CreStk4f/f mice were adoptively transferred into WT CD45.1+ mice (n ≥ 5). Cell localization in different regions of spleen (determined by in vivo PE labeling, as in (F)) was examined by flow cytometry for transferred Treg cells recovered at 36 h after injection. (H) As in (F), frequency of p-STAT5+ population in YFP+ Treg cells from different regions (labeled with or without CD4-PE) of the spleen in Foxp3Cre and Foxp3CreStk4f/f mice (n = 3) was analyzed. (I) As in (G), frequency of p-STAT5+ population in CD45.2+YFP+ Treg cells from different regions of spleen (labeled with or without CD4-PE) in Foxp3Cre (n = 5) and Foxp3CreStk4f/f mice (n = 6) was analyzed. Data in plots indicate means ± s.e.m. NS, not significant; *P < 0.05, ***P < 0.001; two-tailed unpaired Student’s t test (D–I). Data are from one experiment (A, B), representative of 3 independent experiments (C), or pooled from 2 experiments (D–I). See also Figures S6 and S7 and Table S2.

