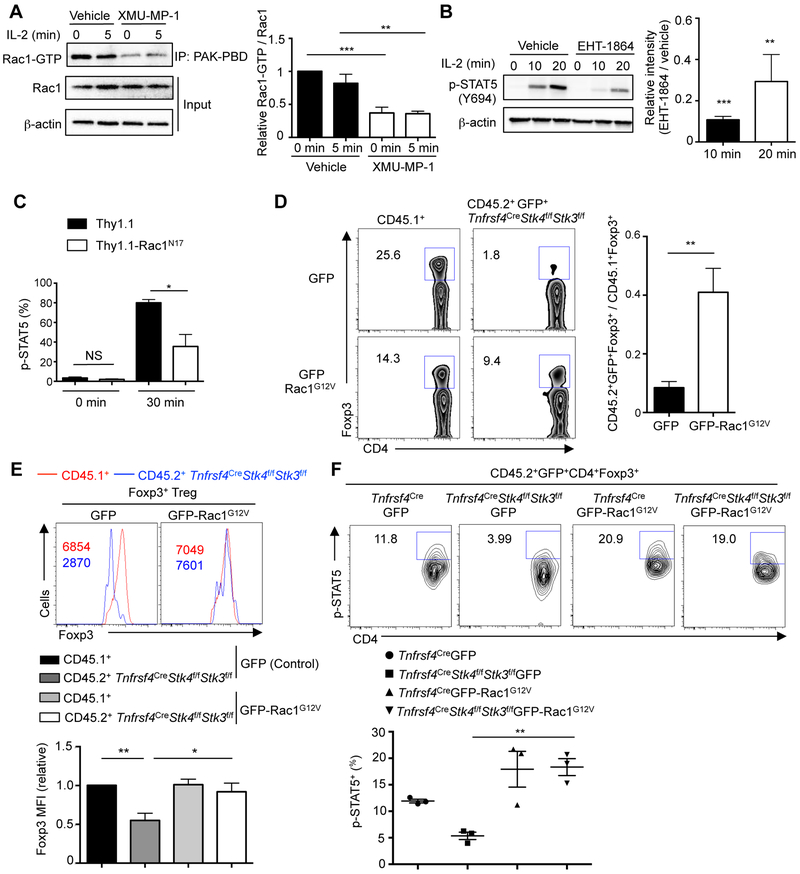
Figure 7. Rac activation mediates Mst1–Mst2 function in the interplay with IL-2–STAT5 signaling and the maintenance of Foxp3 expression and p-STAT5+ subpopulation.
(A) Treg cells were expanded with IL-2–α-IL-2 (JES6–1) complex in vivo, starved in serum-free medium for 4 h with or without Mst1 inhibitor (n = 4), and then stimulated with IL-2 (100 U/ml) for 5 min. Rac1-GTP was immunoprecipitated by PAK-PBD beads, followed by immunoblot with Rac1 antibody. Total Rac1 expression was also analyzed in the lysate (input). Rac1 activity was calculated by the ratio between Rac1-GTP vs. Rac1 intensity in the immunoblot, with 0 min vehicle group normalized to 1 in statistics. (B) Immunoblot analysis of p-STAT5 in WT Treg cells pretreated with vehicle or Rac inhibitor EHT-1864 (n = 3) for 1 h, followed by IL-2 stimulation. p-STAT5 was quantified between EHT-1864 and vehicle treated groups (n = 3). (C) WT Treg cells were transduced with dominant-negative Thy1.1-Rac1N17 or control Thy1.1 retroviral vector (n = 3), rested for 4 h at 37°C, and re-stimulated with 1 U/ml IL-2 for 0 or 30 min. Analysis of p-STAT5 is performed by flow cytometry and the frequency of p-STAT5+ Treg cells was quantified. (D) Flow cytometry analysis of Foxp3+ Treg frequency in CD4+ T cells from CD45.2+GFP+ (GFP or GFP-Rac1G12V) and CD45.1+ (spike) populations in retrogenic mice (generated by reconstituting Rag1−/− mice with Tnfrsf4CreStk4f/fStk3f/f BM cells transduced with GFP or GFP-Rac1G12V retrovirus, together with CD45.1+ BM cells to prevent autoimmunity). Right, fold change of Foxp3+ Treg frequency of CD45.2+GFP+ (GFP or GFP-Rac1G12V) vs. CD45.1+ population in retrogenic mice (n = 4). (E) Flow cytometry and statistics of Foxp3 expression in CD4+Foxp3+ Treg cells of CD45.2+GFP+ (GFP or GFP-Rac1G12V) and CD45.1+ spike populations in the same retrogenic mice as in D. Numbers in graphs indicate MFI. Foxp3 MFI in CD45.1+ Treg cells of control retrovirus transduced mice was normalized to 1. (F) Flow cytometry and statistics of p-STAT5+ frequency in CD4+Foxp3+ Treg cells of CD45.2+GFP+ (GFP or GFP-Rac1G12V)+ populations in lymph nodes of retrogenic mice (n = 3) (generated as in (D)). Numbers in gates indicate percentage of cells. Data in plots indicate means ± s.e.m. NS, not significant; *P < 0.05, **P < 0.01, ***P < 0.001; two-tailed unpaired Student’s t test (B–D) or one-way ANOVA (A, E, F). Data are representative of at least 2 independent experiments (A, B, D– F), or pooled from 3 experiments (C). See also Figure S7.

