
Figure 6.
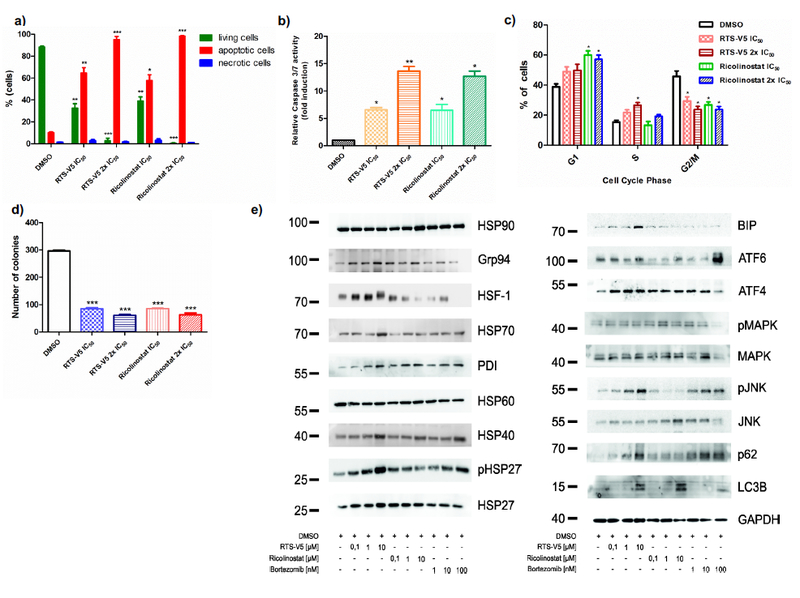
RTS-V5 as a potent inhibitor in a leukemic cell line. a) SEM cells were treated with RTS-V5 and ricolinostat at IC50 or at 2x IC50 concentration for 48 h. Subsequently dual staining was performed with annexin V/PI and measured by FACS. Viable cells (-ve for annexin V/PI) were analyzed if they are necrotic (+ve for PI) and are either in an early (+ve for annexin V) or in a late (+ve for both annexin/PI) apoptotic stage. The bar graph is depicting the percentage of living, apoptotic and necrotic cells after 48 h exposure to RTS-V5 or ricolinostat. b) SEM cells were treated with RTS-V5 for 48 h followed by determining the enzymatic activity of caspase 3/7 by applying a Glo assay (absorbance at 405 nm) to record the induction of apoptosis. c) SEM cells were treated with RTS-V5 for 48 h, and after propidium iodide staining cell cycle analysis was carried out by FACS. d) SEM cells were seeded in a semisolid methylcellulose-based medium after 48 h treatment with RTS-V5 or controls. Next, the impact of RTS-V5 on the differentiation ability of leukemic cells was evaluated. The bar-graphs depict the colonies counted after 14 days. e) SEM cells were treated with bortezomib, ricolinostat, and RTS-V5 at the indicated concentration for 18 h, after which the expression of proteins involved in the HSR, UPR and autophagy were analyzed by western blot analyses. The achieved values depicted in the Figure 6 are plotted as a bar graph. Columns depict the mean of 3 independent experiments (n = 3). Significance analyses of normally distributed data with variance similar between groups used paired, two-tailed student’s t-test. * p < 0.05, ** p < 0.005, *** p < 0.001.