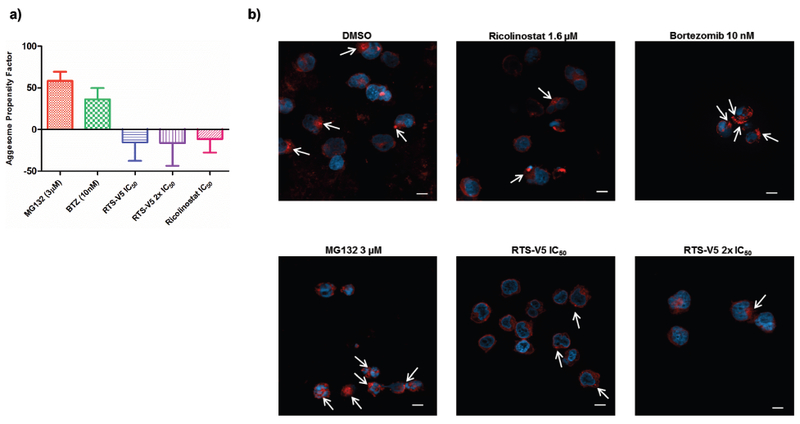
Figure 7.

Effect of RTS-V5 on the aggresome accumulation. a) SEM cells were treated with the respective compounds at their indicated concentration for 18 h. In the following, the Enzo proteostat aggresome detection kit was used to stain the cells along with their DNA. Pictures were taken with a 63X objective using fluorescence microscopy. Scale = 10 μm. b) Treated SEM cells were analyzed by FACS upon staining with aggresome dye to determine the aggresome propensity factor according to the relative mean fluorescence intensity (MFI).
