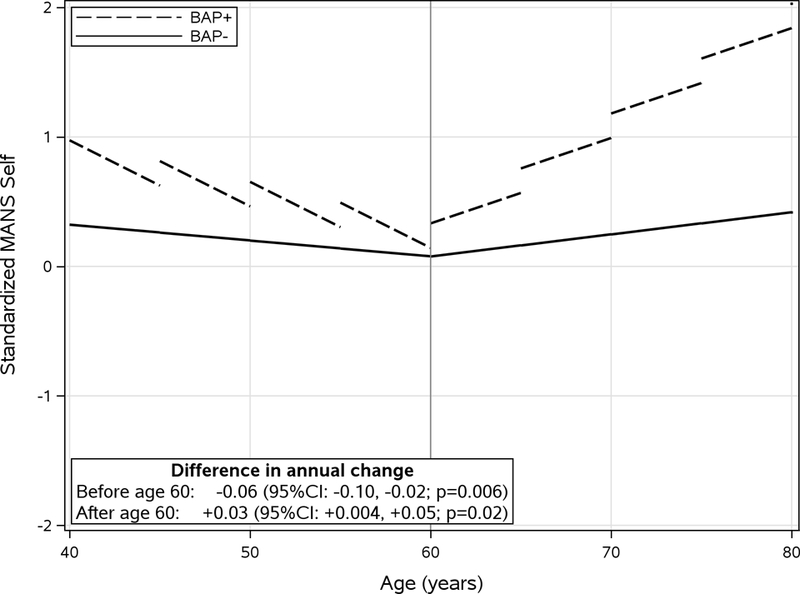
Figure 2.

Standardized longitudinal trajectory of MANS-self score by BAP group before and after age 60. Linear pricewise predicted mean scores divided into 5-year intervals illustrate longitudinal scores (annual change). Models were adjusted for sex and education level. Difference in annual change was calculated as the difference between BAP group slopes (BAP+ minus BAP−). CI: Confidence interval.
