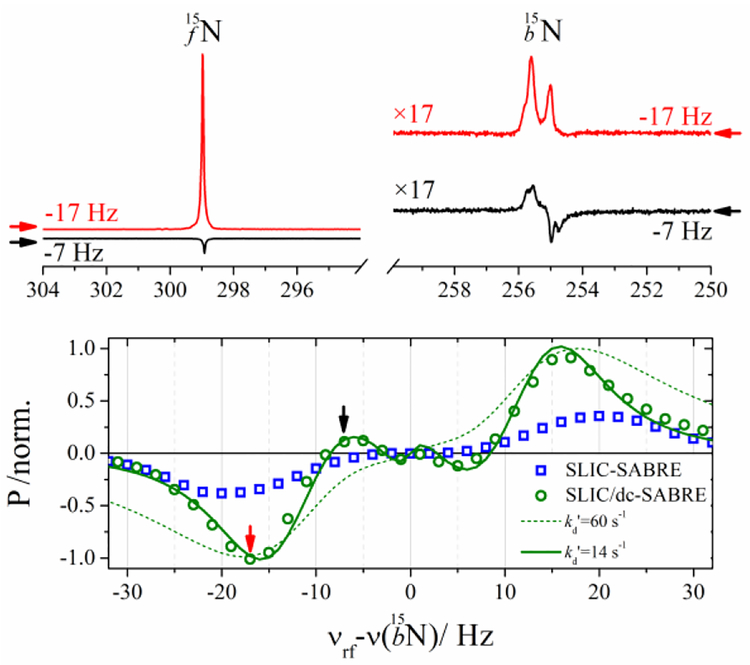
Figure 3.
(Top) High-resolution 15N NMR spectra of free (15Nfree) and bound (15Nbound) 15N-Py signals after application of SLIC/dc-SABRE{1H} with v1 = 5 Hz, n=20 and vrf − v(15Nbound)=−17 Hz (red) or −7 (black) at T = 15 oC,. (Bottom) Normalized polarization level of SLIC/dc-SABRE{1H} (green circles) and SLIC-SABRE{1H} (blue squares) as a function of vrf − v(15Nbound). Green lines are the result of quantitative SABRE model for [IrH2S2] complex with S = 15N and (solid line) or 60 s−1 (dashed line). Arrows indicate the offsets corresponding to the spectra demonstrated above.

