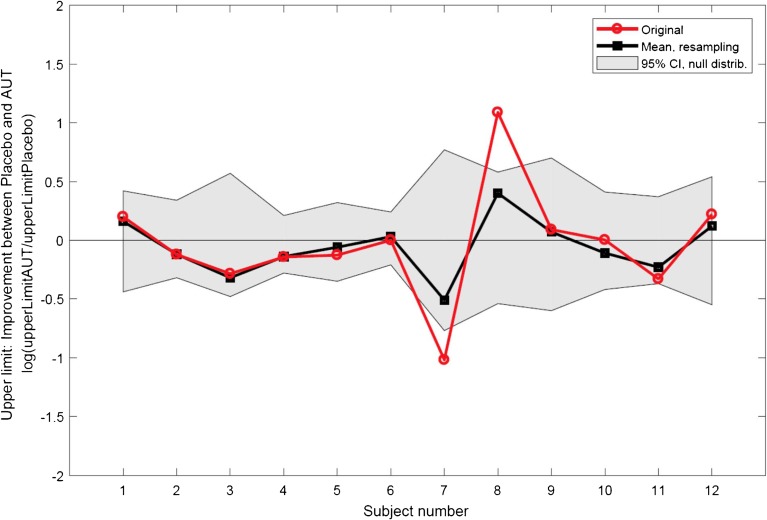
Fig. 6.
Results of the resampling analysis of the upper-limit data. The ordinate shows the difference between the logarithms of the upper limits in the AUT00063 and placebo conditions (positive values reflect an increase). The solid black line shows the mean of the values obtained for each subject from the broken-stick fits to 200 resamplings of 5 sub-blocks. The shaded area shows the 95 % confidence intervals of the null distribution (see text for details). The solid red line shows the values obtained from our original analysis (Figs. 4 and 5), based on the broken-stick fits to the data from all 10 sub-blocks

