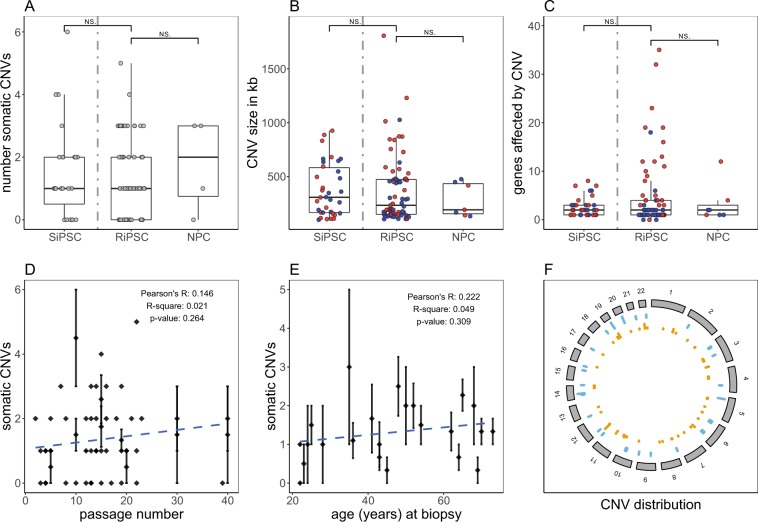
Figure 2.
Summary of somatic CNVs identified in iPSC cultures by chromosomal microarray analysis (CMA). Box- and scatterplots for (A) the total number of somatic CNVs detected per analyzed cell culture sample (grey dots), (B) the genomic length (hg19) in kb of all detected somatic CNVs (C) and the number of affected genes (GenBank) within identified somatic CNVs (red dots = copy number loss, blue dots = copy number gain). SiPSC and RiPSC are separated by a grey dashed line. In the NPCs derived from the RiPSCs no new somatic CNVs were identified. No significant differences regarding number, size and gene content of somatic CNVs between RiPSC (n = 49) and SiPSC clones (n = 23) were detected (two sided Wilcoxon signed-rank test). Aneuploidies are not included and CNV outliers (one in SiPSC and one in RiPSC) sized over 5000 kb are excluded from panels B and C. (D) The average number of CNVs in all iPSCs grouped per individual and passage number plotted vs. the passage number. The dashed blue line represents the linear regression model fit (R2 = 0.021, p-value = 0.264). (E) The average number of CNVs in all iPSC grouped per individual plotted vs. the donor age in years at biopsy. The dashed blue line represents the linear regression model fit (R2 = 0.049, p-value = 0.309). Diamonds in D and E mark the respective average CNV count and are intersected by a standard error bar where applicable. (F) Circos plot showing the genomic (hg19) distribution of somatic CNVs in RiPSC (orange) and SiPSC (blue) clones. NS, not significant.

