
Figure 6.
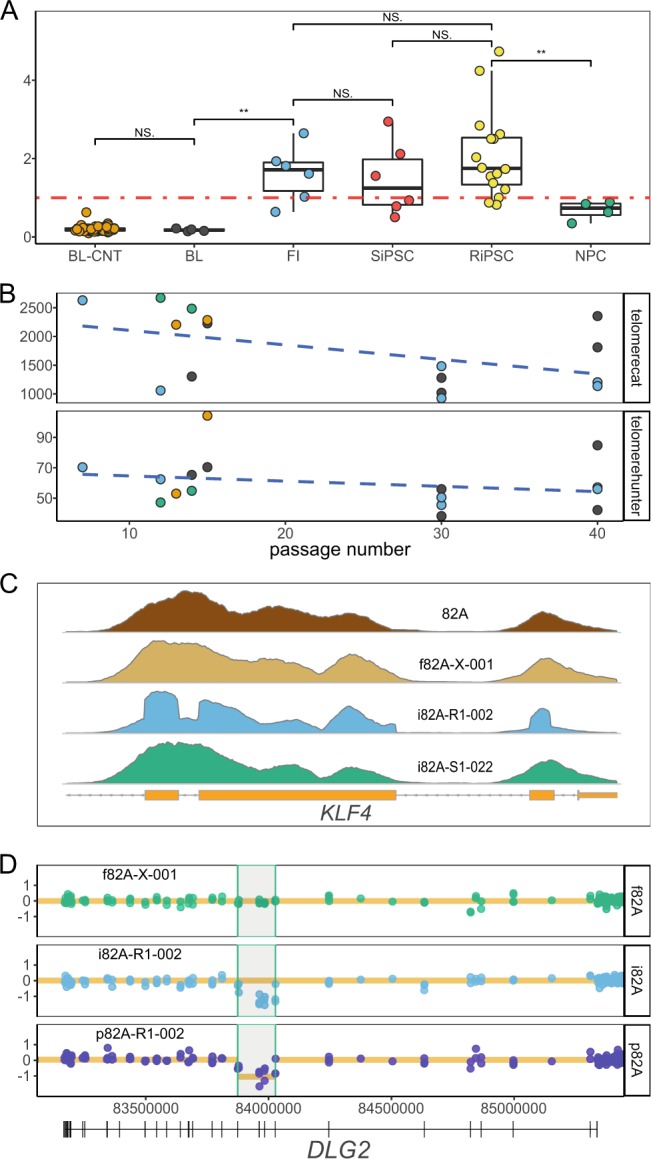
Exome sequencing enables multiple cellular analyses. (A) Box- and scatterplots of the relative mitochondrial genome ratio for all samples. Average read coverage for the mitochondrial genome (chrM) was normalized to the targeted regions of chromosome 1 (chr1). The level of significance is annotated by asterisks or as not significant (NS) (two sided Wilcoxon signed-rank test). Fibroblast (FI) and RiPSC/SiPSC cultures show a higher mitochondrial genome dosage than PBLs (BL = blood samples from individuals in this study; BL-CNT = blood samples from 53 in-house control samples) and compared to NPC cultures. (B) Telomere content of all 16 RiPSC samples from the 4 individuals estimated from off-target telomeric reads by two different algorithms, telomerecat (upper panel) and telomerehunter (lower panel) plotted vs. the passage number. While both plots show a negative correlation of telomere content with higher passage number (telomerecat: Pearson’s r = −0.483, R2 = 0.233, p-value = 0.058; telomerehunter: Pearson’s r = −0.251, R2 = 0.062, p-value = 0.349) the results are not significant (see also Fig. S5). (C) Comparison of the read coverage profile at the KLF4 gene locus of different materials from individual “82A” (blood = brown, fibroblast = tan, SiPSC = green, RiPSC = blue). The sudden breaks at the exon-intron boundary indicate multiple integrations of a plasmid with a KLF4 transcription factor insert which has no introns (see also Fig. S6). (D) Example of a somatic deletion in the DLG2 gene called from the exome data of the NPC sample (“p82A-R1-002” = dark blue) and absent in the corresponding fibroblast culture (“f82A-X-001” = green). Dots represent target or anti-target coverage bins (y-axis = log2 ratio) and the orange line marks the copy number call by the CNVkit algorithm32 for each segment. Note that the deletion was only called in the NPC and not in the RiPSC (“i82A-R1-002” = light blue) although the deletion had been previously confirmed in both samples by CMA (see also Fig. S6). NS, not significant; “***”, 0.001; “**”, 0.01, “*”, 0.05.