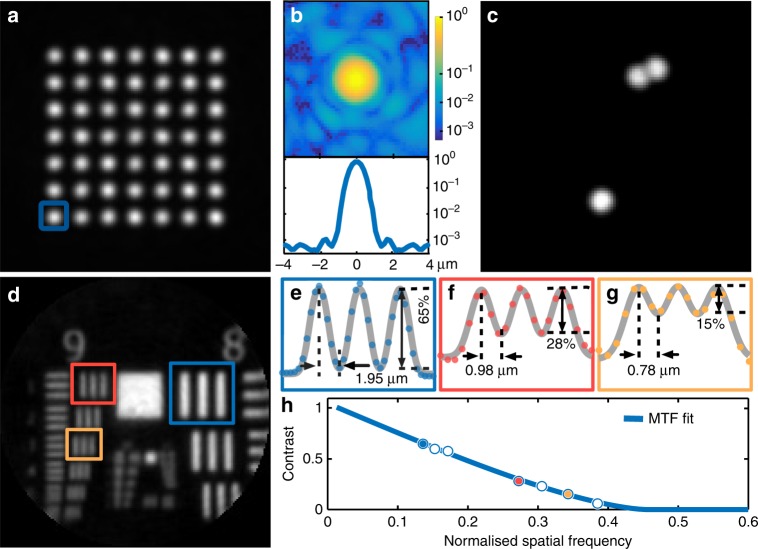
Fig. 2. Evaluation of the imaging performance.
a Combined foci (sum projection) at the distal MMF facet demonstrating the power uniformity of focusing at different locations. b Intensity distribution and azimuthally averaged profile of a chosen focal point (indicated by a blue square in panel a) in logarithmic scale. c Validation of fluorescent imaging using 4-µm fluorescent particles. d–h Assessment of spatial resolution using a negative USAF-1951 test target. Image of the test target (d) and contrast measurements of selected target elements with 265 line pairs per millimetre (lp/mm) (e), 512 lp/mm (f), and 645.1 lp/mm (g). h Imaging contrast as a function of the normalised spatial frequency for the target elements in (d), and the fit of the modulation transfer function (MTF) corresponding to an aberration-free imaging system with a circular aperture. The fit allows an estimation of the effective numerical aperture (NA) as 0.225 ± 0.008 and the corresponding resolution limit (Abbe criterion) as 1.18 ± 0.04 µm

