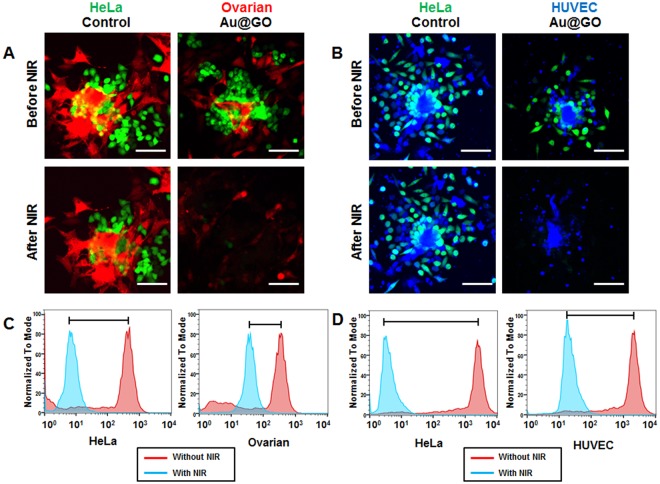
Figure 7.
Analysis on PTT-treated co-culture spheroids. Confocal fluorescent microscopy images of HeLa (Green)/Ovarian (Red) co-culture spheroids before and after NIR treatment (A). Confocal flurescent microscopy images of HeLa (Green)/HUVEC (blue) co-culture spheroids before and after NIR treatment (B). FACS analysis of cell viability of HeLa/Ovarian co-culture spheroids in PTT (C). Analysis of cell viability by FACS of HeLa/HUVEC co-culture spheroids in PTT (D). All scale bars are 100 µm.

