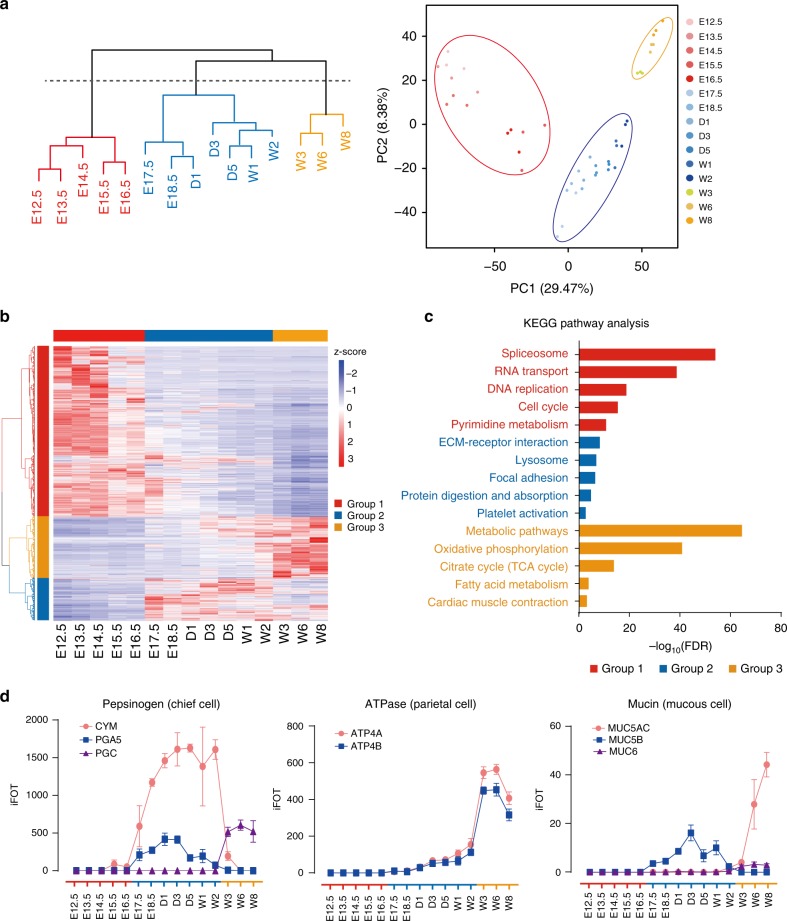
Fig. 2.
Three developmental phases and their biological functions and features. a Hierarchical clustering and PCA analyses of temporal proteomic data to separate the whole developmental process into three phases. b Coexpression analysis of 4300 differentially expressed proteins by semi-supervised, Ward’s hierarchical clustering. c KEGG pathway analysis of three protein groups. d Changes of three protein families and eight individual stomach markers across 15 timepoints or three developmental phases. Error bars are created by mean ± SD of three replicates. a red, Ph1; blue, Ph2; and orange, Ph3. b horizontal color bars: red, Ph1; blue, Ph2; and orange, Ph3. vertical color bars: red, group 1; blue, group 2; orange, group 3. c color bars: red, pathways enriched in group 1; blue, pathways enriched in group 2; and orange, pathways enriched in group 3

