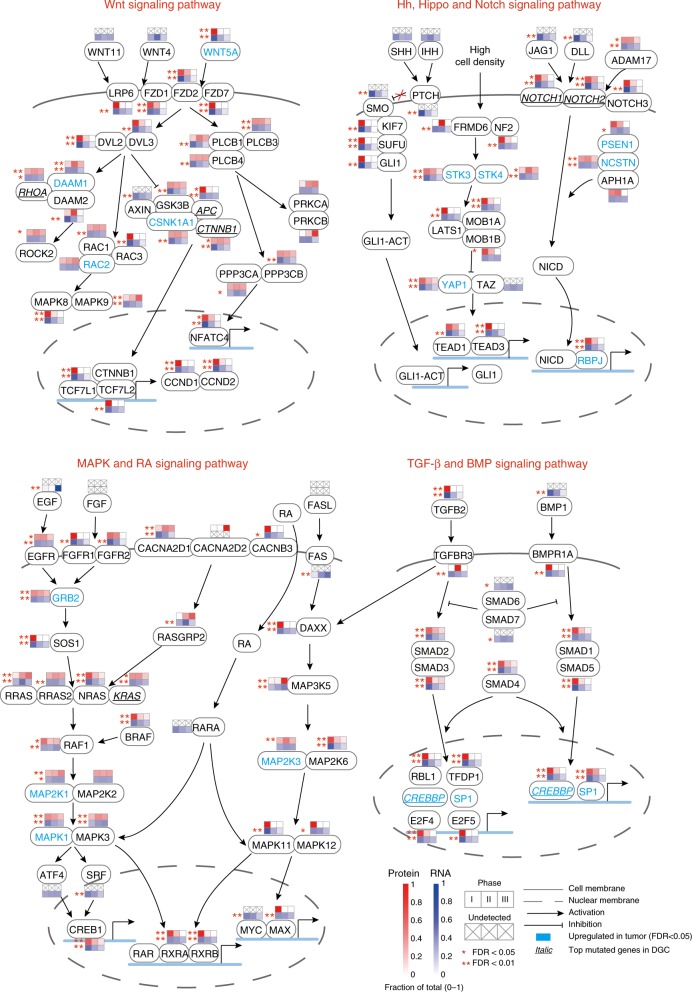
Fig. 5.
Key signaling pathways involved in stomach development and gastric cancer. Statistical analyses of proteomic and transcriptomic data to identify differentially expressed genes (small lower squares on each gene symbol) or proteins (small upper squares on each gene symbol) in stomach development. Proteins differentially expressed and genes frequently mutated in DGC were compared to those in stomach development. Cross marks represent genes or proteins that are not detected in the study; solid lines represent cell membranes; dashed lines represent nuclear membranes; lines with solid arrows illustrate activation of downstream genes; lines with hammer-heads illustrate inhibition of downstream genes; gene symbols in cyan are upregulated in tumor (FDR < 0.05); italic gene symbols with underlines are top mutated genes in DGC

