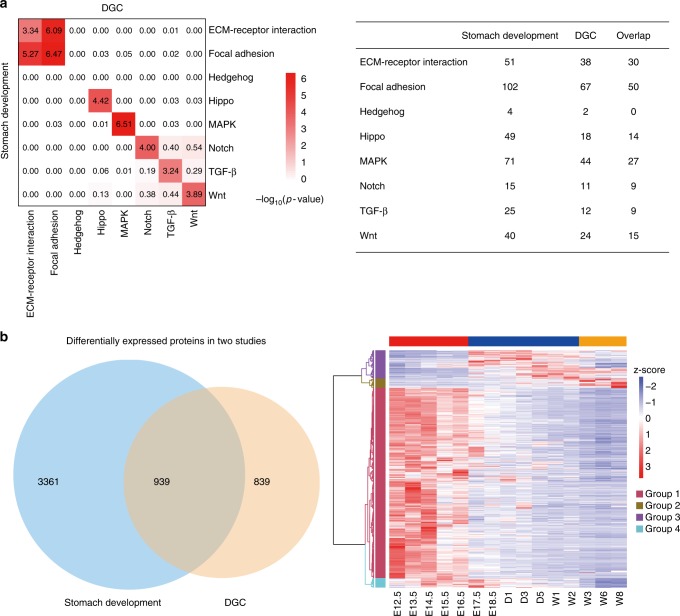
Fig. 6.
Comparative analyses of stomach development and gastric cancer. a Two-tailed hypergeometric tests were conducted to determine whether there is a significant overlap of altered genes on a specific pathway between stomach development and diffuse-type gastric cancer. Upper left: Correlations on eight signaling pathways between stomach development and DGC. Upper right: the number of significantly altered and overlapping genes on eight signaling pathways in stomach development and DGC. b Venn diagram of genes or proteins (ANOVA, FDR < 0.01) differentially expressed in stomach development and DGC (ttest, FDR < 0.05, ratio of tumor over nearby tissues ≥ 2) (Lower left); Temporal expression patterns of 939 overlapping genes across 15 timepoints (Lower right). Right panel, horizontal color bars: red, Ph1; blue, Ph2; and orange, Ph3. Vertical color bars: deep pink, group 1; gold, group 2; purple, group 3; and cyan, group 4

