Figure 2.
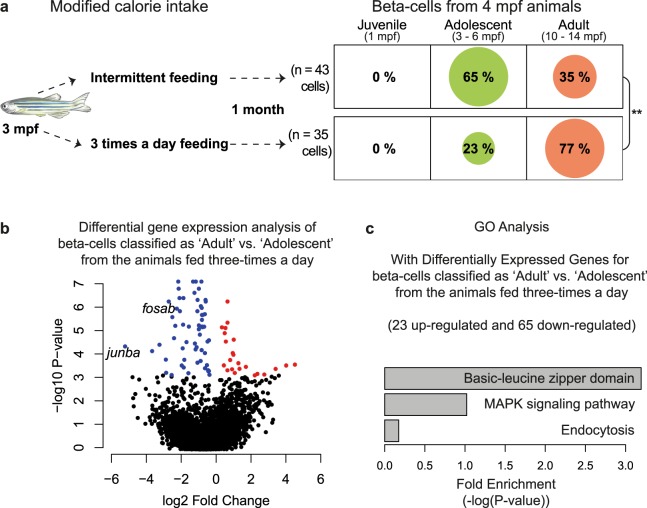
Impact of calorie intake on the chronological stage of zebrafish beta-cells. (a) The impact of calorie intake on the classification stage of beta-cells was investigated. A higher proportion of beta-cells from the animals fed three-times-a-day were classified by GERAS as ‘Adult’, as compared to cells from animals on intermittent feeding, in which a majority of the cells (65%) were classified as adolescent. (Fisher’s Exact Test, **p-value < 0.01). (b) Volcano plot summarizing the differential expression analysis of beta-cells classified as ‘Adult’ or ‘Adolescent’ from the animals fed three-times a day. Colored dots represent significantly regulated genes (false-discovery rate (fdr) < 0.05). Red dots represent up-regulated genes, while blue dots represent down-regulated genes. (c) Gene-ontology (GO) analysis of the differentially regulated genes using DAVID42. This analysis includes the down-regulated (blue in b) and up-regulated (red in b) genes. Zebrafish illustration provided with permission from Priyanka Oberoi.

