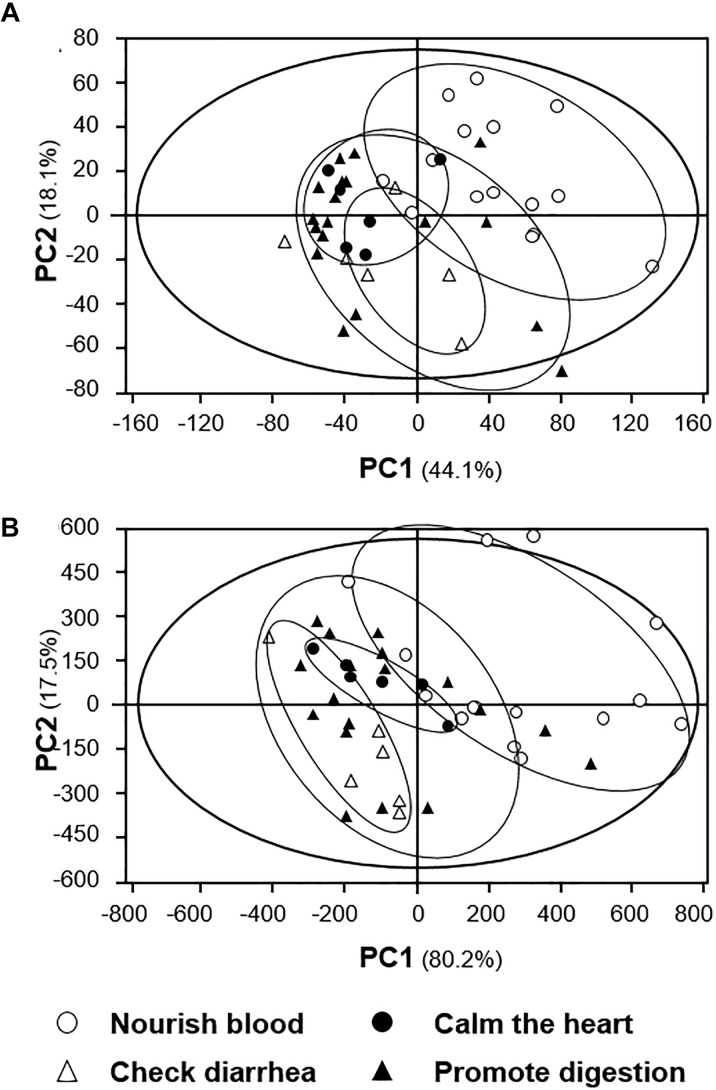
FIGURE 7.
PCA analyses of (A) TIC and (B) spectrum profiles of signals from the 15 spleen-meridian herbs. Similarly, the distribution of each herbal extract in score scatter plots was calculated according to its correlation with the major components. The classification of the herbal extracts was according to the proposed pharmacological activity, as described in TCM practice. The results showed relatively higher discrimination between different types of extracts.

