Fig. 6.
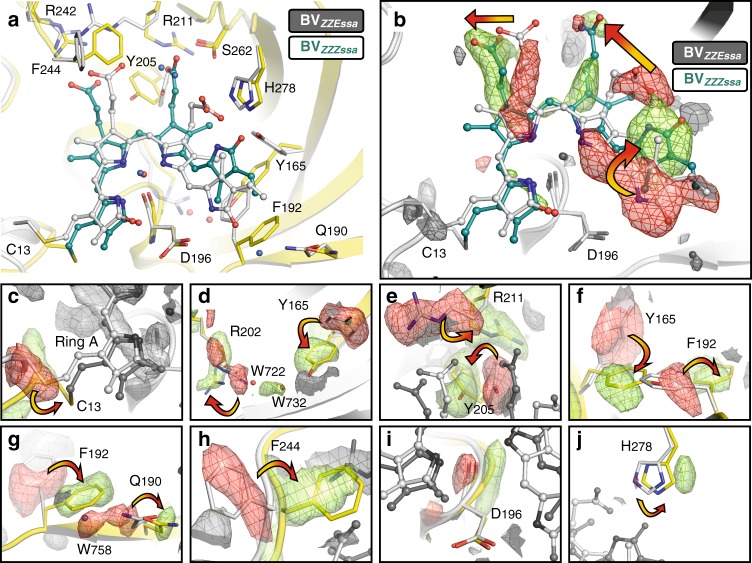
Superposition of Agp2-PAiRFP2 Meta-F and Pfr state. a Cartoon representation of the structures of the chromophore pocket. BV and amino acids of the chromophore pocket are shown as ball/sticks and sticks, respectively. In the Pfr structure, BV and amino acid side chains are coloured light grey and water molecules are depicted as blue spheres. In the Meta-F sub-state structure (Mol A), BV is coloured teal, protein in yellow and water molecules are depicted as red spheres. b The FoMeta-F−FoPfr electron density map of BV shows structural changes in the chromophore associated with the Pfr→Meta-F transition. Expanded views of sections of b are shown in c–j. Positive FoMeta-F−FoPfr electron density map is coloured green, whereas negative ΔFo electron density is coloured in red. For the sake of clarity, ΔFo electron density and amino acids that do not belong to the highlighted amino acid in the corresponding figure were coloured light and dark grey. In c–j, ΔFo electron density is contoured at 3.0 σ and in b at 4.0 σ

