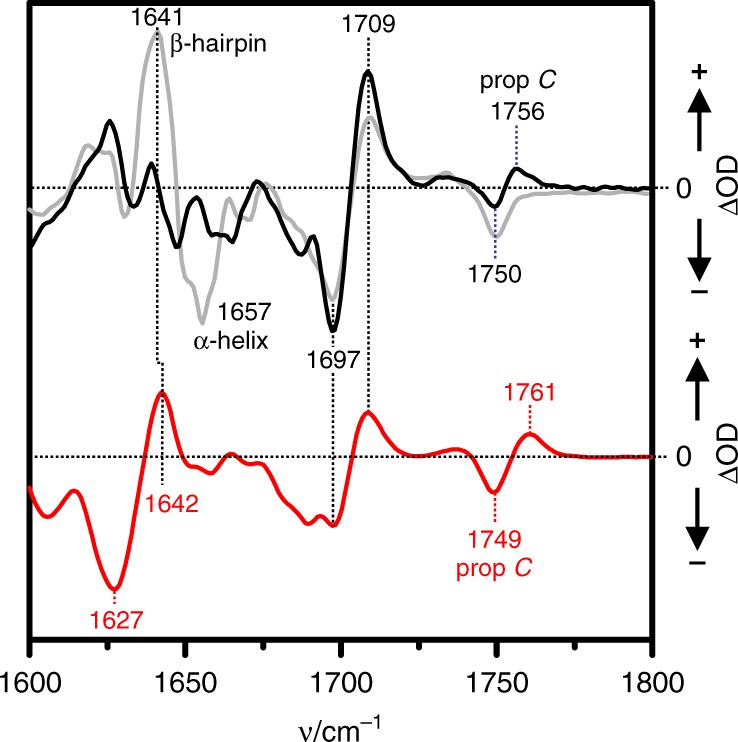
Fig. 8.

Photoinduced infra-red (IR) difference spectra of Agp2 variants in solution. Black trace (top): wild-type Agp2-PCM difference spectrum obtained after irradiation at ca. 240 K corresponding to the Meta-F-minus-Pfr difference spectrum (taken from ref. 17); red trace (bottom) Agp2-PAiRFP2, difference spectrum obtained after irradiation at 273 K. The grey trace (top) refers to the difference spectrum Pr-minus-Pfr of full-length wild-type Agp2, generated upon irradiation at 273 K (spectrum taken from ref. 17). Note that the Pr state could not be enriched for the wild-type Agp2-PCM due to the fast thermal back conversion to the Pfr state60. In each spectrum, the negative signals refer to Pfr, whereas the positive signals correspond to the respective photoproduct
