Figure 2.
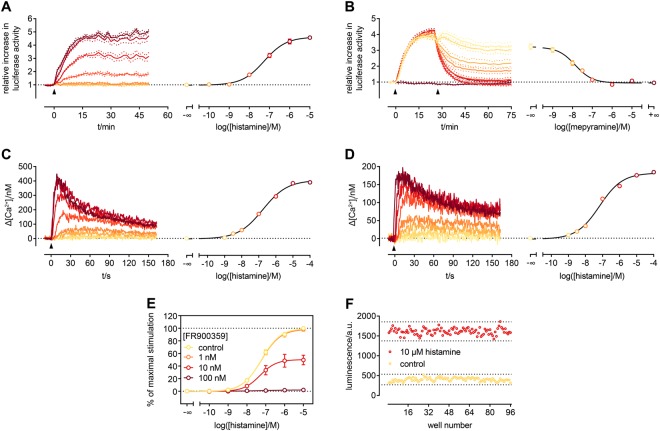
Characterization of the Gαq activation sensor. All experiments were performed with HEK293T cells, expressing the Gαq sensor and the hH1R, except for C were the sensor was not present. Increasing concentrations of histamine (addition indicated by arrow) lead to proportionally increasing luminescence emitted from the cells, which can be converted to a CRC (A). The opposite (a gradual decrease in luminescence) became obvious, when stimulated cells (300 nM histamine, first arrow) were subsequently treated with the selective hH1R agonist mepyramine (second arrow) (B). In case of the highest concentration, luminescence decreased to basal levels, indicating full reversibility of the sensor interaction. Since the observed activation kinetics in A was slower than expected for G protein activation, a kinetic Fura-2 assay for the quantification of [Ca2+]i was performed, to guarantee that the sensor does not negatively influence downstream signalling. In cells, in which the sensor was present, the kinetics was the same (C) when compared to cells devoid of the sensor (D). The concentration-dependent response to histamine (addition indicated by arrow) was similar (hH1R alone: pEC50: 7.1 ± 0.1; Gαq sensor present: pEC50: 6.8 ± 0.1), too. Furthermore, we were able to show that the modified Gαq as part of the sensor was still prone to inhibition by FR900359 (E). The sensor shows an exceptionally good Z’ of 0.7 (F). Data in A-D are representative of at least two independent experiments. Data in E are presented as mean along with their SEM from five independent experiments performed in triplicate. Data in F was obtained from an entire 96-well plate.

