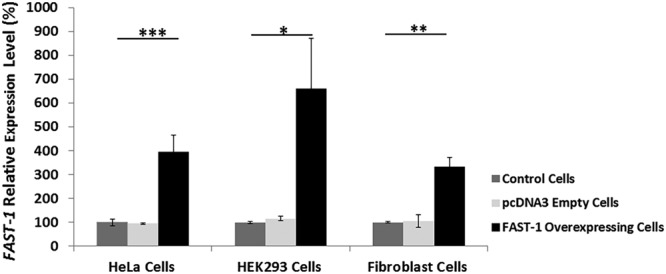
Figure 2.

Relative FAST-1 expression in FAST-1 overexpressing cells. FAST-1 overexpression was confirmed in FAST-1 transfected cells compared to non-transfected and empty-vector-transfected control cells. Data were normalized to the mean FAST-1 level of non-transfected control cells taken as 100%. (n = 12, FAST-1 overexpressing HeLa and HEK293 clones), (n = 3, FAST-1 overexpressing fibroblast clones), *p < 0.05, **p < 0.01, ***p < 0.001, Bars represent SEMs.
