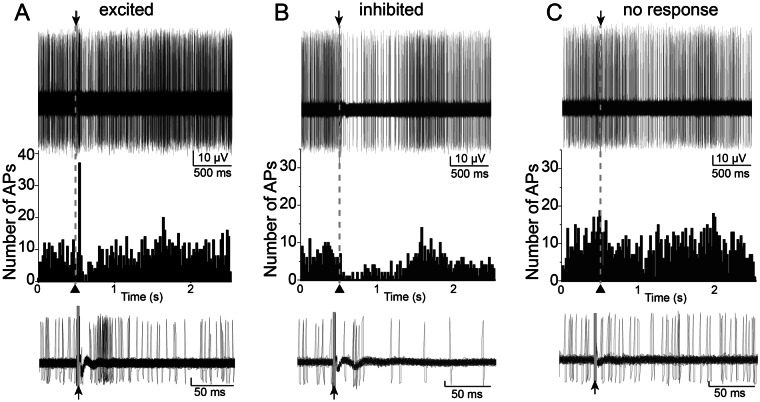
Figure 3.
Patterns of neuronal response to PFC stimulation. Single neurons were recorded throughout the BLA. Three types of responses were characterized based on criteria (Methods). Shown in all the examples here are 50 consecutive overlaid traces of the response to stimulation (top), the peristimulus time histograms (middle) and overlaid traces of the responses at a smaller time scale (bottom). Stimulation occurred at the arrowheads. (A) Example of a neuron that displayed excitation in response to PFC stimulation. (B) Example of a neuron that displayed inhibition in response to PFC stimulation. (C) Example of a neuron that displayed no response to PFC stimulation. Stimulation artifacts were blanked for clarity.

