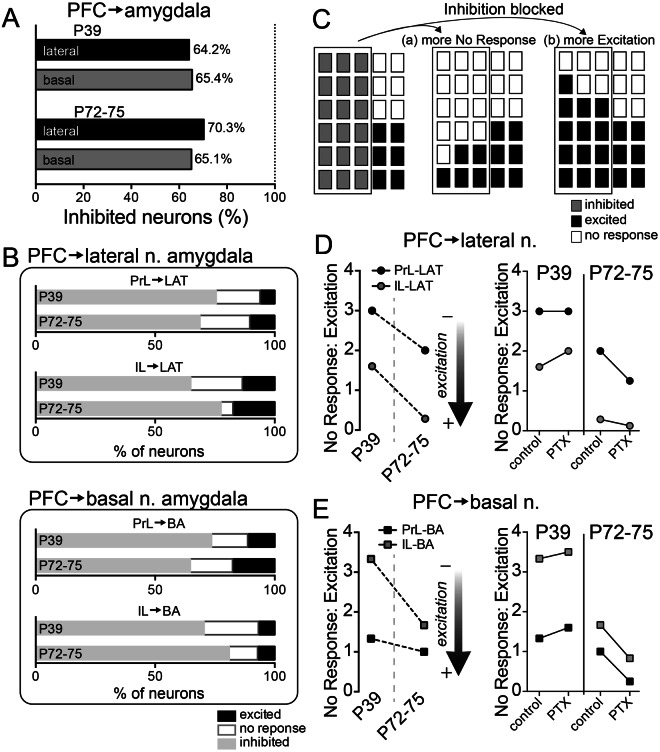
Figure 4.
Proportion of response types across age. The response of BLA neurons to PFC stimulation was characterized by response type (Excitation, Inhibition, No Response) and by stimulation location (prelimbic (PrL) or infralimbic (IL) PFC). (A) The majority of BLA neurons in PND 72–75 and PND 39 rats had an Inhibition response type upon PrL or IL stimulation. (B) The distribution of Excitation and No Response measured in the LAT and BA demonstrate their occurrence (~30–35%) relative to all responses. (C) Parts-of-whole plot to illustrate the distribution of response types under baseline conditions (left), and two possible outcomes after blockade of inhibition with PTX. Each plot represents a population of BLA neurons, with each rectangle representing a neuron. The outlined neurons on the left represent BLA neurons that show a GABAA-mediated inhibitory response. When this inhibitory response is blocked by PTX these neurons might mostly respond to PFC in one of two ways: (a) the previously Inhibited neurons are now mostly No Response, or (b) the previously Inhibited neurons are now mostly Excited. (D) The ratio of No Response to Excitation types in LAT was quantified to gain insight into their relative distribution across age. There was a shift towards lower values (more Excitation) in PND 72–75 rats. PTX shifted values towards more Excitation in PND 72–75 rats (IL → LAT, PrL → LAT, p < 0.05, χ2), but more No Response in PND 39 rats (IL → LAT, PrL → LAT, p < 0.05, χ2). (F) The ratio of No Response to Excitation types in BA was quantified. There was a shift towards lower values (more Excitation) in PND 72–75 rats. PTX shifted values towards more Excitation in PND 72–75 rats (IL → BA, PrL → BA, p < 0.05, χ2), but more No Response in PND 39 rats (IL → BA, PrL → BA, p < 0.05, χ2).

